
الوصف
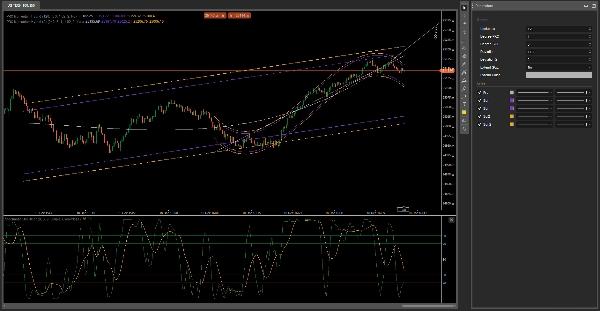
1. مرشح "التسارع مقابل الاتجاه الأساسي".
هذه هي الميزة التقنية الأولى.
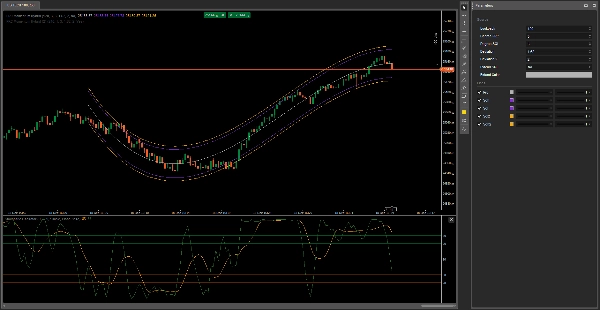
المستوى 1 (خطوط مستقيمة): يمثل زخم السوق أو الاتجاه المتوسط. إنه "الطريق السريع" الذي يجب أن يتبعه السعر.
المستوى 3 (منحنيات): يمثل تسارع السوق والمشاعر العاطفية الفورية.
ميزة المتداول: عندما تنحني قناة المستوى 3 وتخرج من قناة المستوى 1، فهذا يشير إلى ذروة السوق (تجاوز السرعة). إنها التحذير المثالي بأن السعر مفرط في الامتداد وسيرجع قريبًا إلى القاعدة الخطية.
2. تحديد ضغط التقلبات
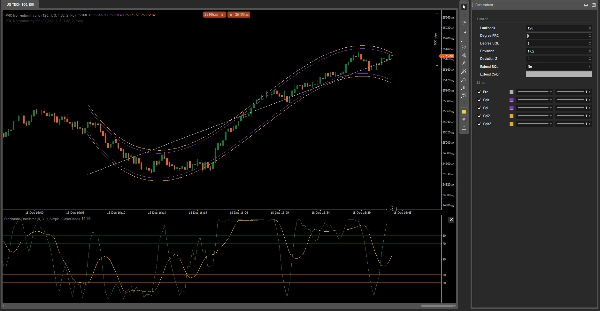
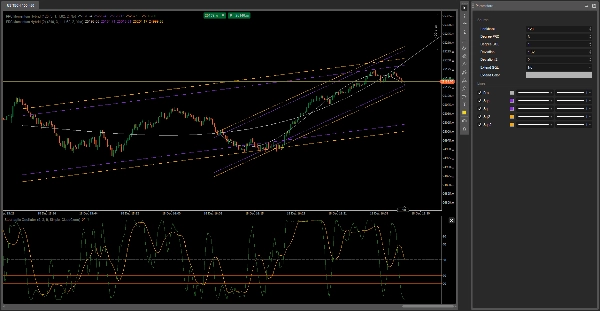
الميزة: تتشكل نقاط ذات احتمالية عالية حيث تتقاطع الخطوط البرتقالية (المستقيمة) والبنفسجية (المنحنية).
كيفية الشرح: "ابحث عن نقاط التقاطع. عندما يتم رفض السعر من قبل خط مستقيم ومنحنى في نفس الوقت، لديك تأكيد مزدوج بأن السعر قد واجه عقبة لا يمكن تجاوزها."
3. "فخ الاتجاه" (التباعد البصري)
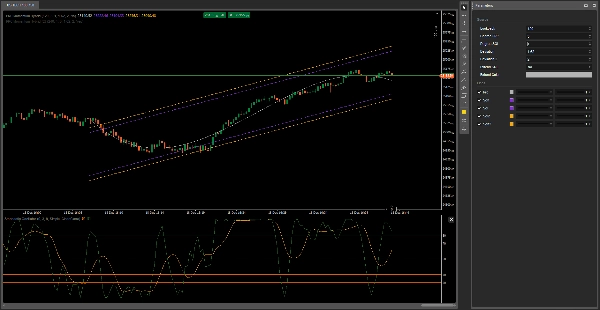
الميزة: يساعد على تجنب الاختراقات الخاطئة.
الشرح: أحيانًا يكسر السعر القناة الخطية (الدرجة 1)، مما يعطينا إشارة شراء، لكن قناة الدرجة 3 تنحني بالفعل إلى الأسفل.
القيمة للمستخدم: "إعدادنا المزدوج يحميك من الفخاخ: إذا أخبرك الخط المستقيم 'اصعد' لكن المنحنى 'ينحني'، ابق خارج الصفقة. المنحنى دائمًا يكتشف الإرهاق قبل الخط المستقيم."
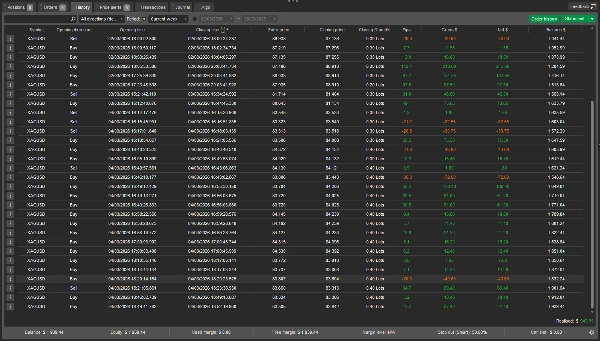
هذه هي الأدوات التي تساعدني على كسب المال
https://ctrader.com/products/3441?u=Thomas-Sparrow
https://ctrader.com/products/526?u=Thomas-Sparrow
الملخص
1. Acceleration vs. Baseline Trend Filter: Detects market climaxes when the acceleration channel breaks out of the baseline trend, signaling potential price reversals from overextended conditions.
2. Volatility Squeeze Identification: Highlights high-probability trading nodes where straight and curved lines intersect, indicating strong price rejection points confirmed by dual resistance.
3. Trend Trap Detection: Provides visual divergence alerts to avoid false breakouts by comparing signals from the linear and curved channels, helping traders identify exhaustion before trend continuation.
The indicator supports analysis across multiple markets including Forex, Indices, Commodities, Crypto, and Stocks. It is intended for use as a powerful visual tool to enhance decision-making by identifying trend strength, momentum shifts, and potential reversal zones.
تقييمات العملاء
5 | 100 % | |
4 | 0 % | |
3 | 0 % | |
2 | 0 % | |
1 | 0 % |


