
Institutional Volume Supply Demand
Indicatore
1.51K download
Versione 1.0, Sep 2025
Windows, Mac
4.4
Recensioni: 5
Descrizione
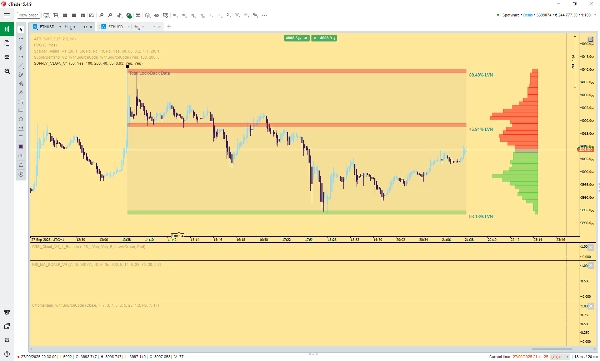
Zone del Profilo di Volume (Offerta/Domanda)
L'indicatore Zone del Profilo di Volume offre una visione di livello istituzionale della struttura del mercato sfruttando l'analisi del Volume al Prezzo. Identifica automaticamente livelli di Supporto e Resistenza ad alta probabilità basati su inefficienze di mercato e vuoti di liquidità.
Caratteristiche principali:
- S&R Istituzionali (LVN): Calcola e segna automaticamente Nodi a Basso Volume (LVN) — aree dove il prezzo si è mosso rapidamente con un volume di scambi minimo. Questi LVN agiscono come zone future di Offerta (Resistenza) e Domanda (Supporto) ad alta convinzione.
- Look-Back Dinamico: Il profilo adatta automaticamente il periodo di analisi per concentrarsi solo sull'attuale swing o trend principale, resettandosi dopo un pivot significativo del mercato.
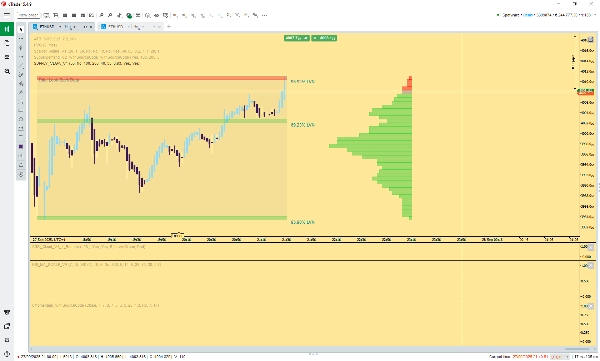
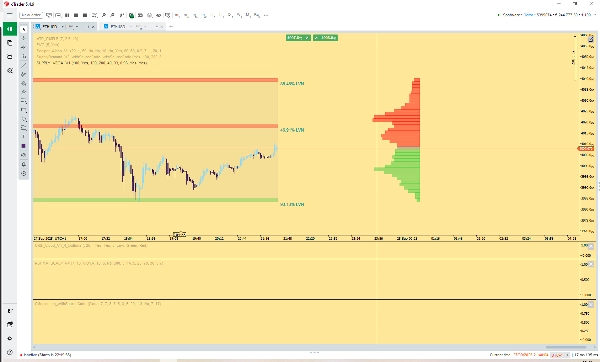
- Colorazione Relativa al Prezzo: L'istogramma visibile del Profilo di Volume e le corrispondenti zone di Offerta/Domanda sono colorate dinamicamente in base al prezzo attuale:
-
- Verde: Aree di volume sotto il prezzo attuale (che agiscono come Domanda/Supporto).
- Rosso: Aree di volume sopra il prezzo attuale (che agiscono come Offerta/Resistenza).
- Forza LVN: Le zone sono etichettate con una percentuale che indica la debolezza del volume a quel livello, fornendo una misura oggettiva della forza teorica della zona (dimensione del vuoto di liquidità).
Questo strumento è essenziale per i trader che utilizzano tecniche avanzate di struttura di mercato, flusso di ordini o Profilo di Volume per identificare punti chiave di interesse e anticipare le inversioni di mercato.
Riepilogo
Riepilogo AI
The Institutional Volume Supply Demand indicator offers an advanced market structure analysis using Volume Profile Zones based on Volume at Price data. It automatically identifies key Support and Resistance levels by detecting Low Volume Nodes (LVNs), which represent areas where price moved rapidly with minimal trading volume, indicating potential future supply (resistance) and demand (support) zones. The indicator dynamically adjusts its look-back period to focus on the current major swing or trend, resetting after significant market pivots. It visually distinguishes supply and demand zones with color coding: green for volume areas below the current price (demand/support) and red for areas above (supply/resistance). Each LVN is labeled with a percentage that quantifies the weakness of volume at that level, providing an objective measure of zone strength based on liquidity void size. This tool supports traders employing advanced techniques such as order flow and Volume Profile analysis to identify high-probability market turning points. It is applicable across various markets including Forex pairs (e.g., EURUSD, GBPUSD, NZDUSD, USDJPY), cryptocurrencies (BTCUSD), indices (NAS100), and commodities (XAUUSD).
Profilo indicatore
Recensioni dei clienti
4.4
Recensioni: 5
5 | 80 % | |
4 | 0 % | |
3 | 0 % | |
2 | 20 % | |
1 | 0 % |
Recensioni dei clienti
May 15, 2026
CTrader's recent update has made this indicator obsolete. It simply stops CTrader from working. this Indicator needs an update to correlate with the Ctrader update.
April 8, 2026
November 3, 2025
Excelente indicador para quem opera baseado em zonas de liquidez, oferta e demanda institucional. Ótimo trabalho!
Discussioni
Domande frequenti
BTCUSD
Forex
Signal
Breakout
EURUSD
GBPUSD
NZDUSD
Bollinger
Fibonacci
ZigZag
Scalping
Fair Value Gap
SMC
Grid
AI
XAUUSD
NAS100
MACD
USDJPY
VWAP
I prodotti disponibili tramite cTrader Store, inclusi bot di trading, indicatori e plugin, sono forniti da sviluppatori terzi e resi disponibili esclusivamente a scopo informativo e di accesso tecnico. cTrader Store non è un broker e non fornisce consulenze in materia di investimento, raccomandazioni individualizzate o garanzie di risultati futuri.


Prezzo
Da 09/01/2025
11.78K
Installazioni gratuite