

present
Zarejestruj się i otrzymaj 50 $ zniżki na pierwszy zakup
Trading product for MyZtrade W1 MN zones Wskaźnik EMA Supertrend, image 1
MyZtrade W1 MN zones
Wskaźnik
Wersja 1.0, Aug 2026
Windows, Mac
Trading product for MyZtrade W1 MN zones Wskaźnik EMA Supertrend, image 2
Trading product for MyZtrade W1 MN zones Wskaźnik EMA Supertrend, image 3
Trading product for MyZtrade W1 MN zones Wskaźnik EMA Supertrend, image 4
Trading product for MyZtrade W1 MN zones Wskaźnik EMA Supertrend, image 5
Od 28/06/2025

Opis

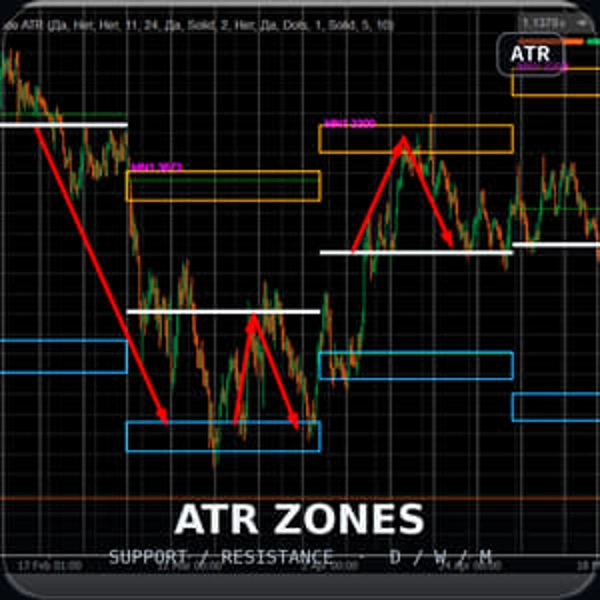
Strefy ATR MyZtrade MTF — wieloczasowe strefy wsparcia i oporu oparte na ATR

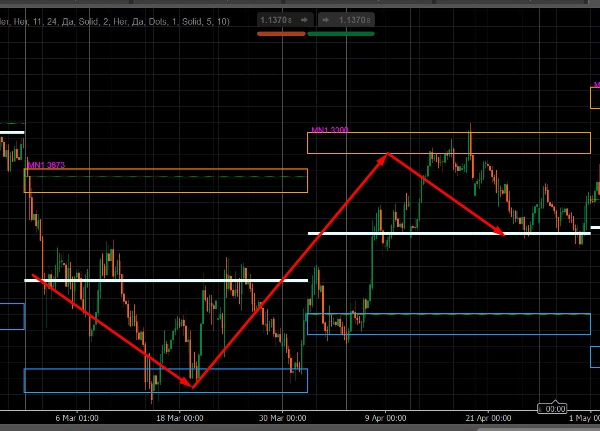
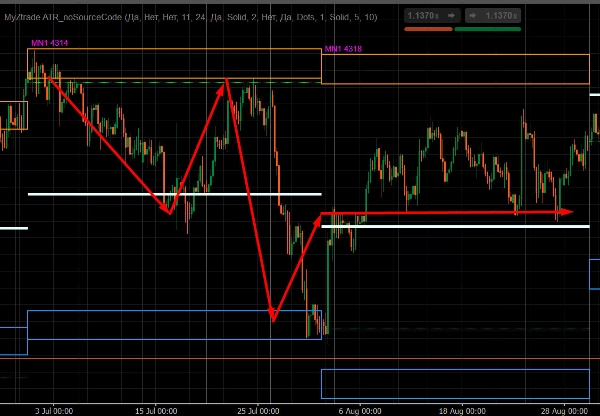
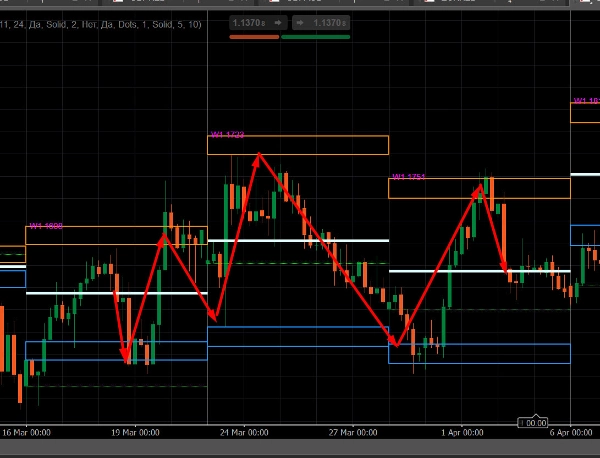
Ten wskaźnik rysuje potencjalne strefy odwrócenia (wsparcia/oporu) na wykresie na podstawie średniego zakresu High–Low słupków z wyższych interwałów czasowych — miesięcznych, tygodniowych i dziennych — niezależnie od interwału wykresu.


Co robi


Dla każdego włączonego interwału (miesięczny / tygodniowy / dzienny) wskaźnik:


• Oblicza średni zakres (High–Low) na podstawie określonej liczby ostatnich słupków w tym interwale (domyślnie: 11 słupków)


• Rysuje prostokątne strefy oporu i wsparcia na wykresie, przesunięte od maksimum/minimum każdego słupka o wartość tego średniego zakresu


• Oznacza każdą strefę wartością zmienności w punktach oraz przedrostkiem interwału (na przykład MN1 2696, W1 1180, D1 340) — przydatne, gdy włączonych jest kilka interwałów jednocześnie


• Dodatkowo rysuje linię ceny otwarcia słupka oraz linię mediany wewnątrz strefy


• Osobno śledzi bieżący (jeszcze niezamknięty) słupek — jego strefa przesuwa się w czasie rzeczywistym wraz z rozwojem słupka


Kluczowe cechy


• Wiele interwałów jednocześnie — miesięczny, tygodniowy i dzienny mogą być włączone niezależnie od siebie


• Niezależny od interwału wykresu — możesz oglądać strefy miesięczne na wykresie godzinowym itd.


• W pełni konfigurowalny wygląd — kolory, grubość i styl linii, wypełnienie/obrys strefy, rozmiar tekstu


• Służy jako przewodnik wizualny; nie generuje sygnałów handlowych i nie zawiera logiki wejścia/wyjścia

Podsumowanie

Podsumowanie AI
MyZtrade W1 MN zones is a multi-timeframe indicator that identifies potential reversal zones of support and resistance on trading charts. It calculates the average range (High–Low) over a configurable number of recent bars (default 11) for selected higher timeframes—Monthly, Weekly, and Daily—regardless of the chart’s current timeframe. The indicator then plots rectangular zones offset from each bar’s high and low by this average range, visually marking areas where price reversals may occur.

Each zone is labeled with its volatility value in points and the corresponding timeframe prefix (e.g., MN1, W1, D1) to distinguish multiple enabled timeframes. Additional visual elements include the bar’s opening price line and a median line within each zone. The indicator also tracks the current, developing bar in real time, updating its zone dynamically.

Key features include simultaneous display of multiple timeframes, full customization of visual appearance (colors, line styles, text size), and independence from the chart’s timeframe, allowing monthly zones to be viewed on intraday charts. This tool serves as a visual guide for support and resistance levels based on volatility but does not provide trading signals or entry/exit logic.
Profil wskaźnika

Opinie klientów

0.0
Opinie: 0
Opinie klientów
Ten produkt nie ma jeszcze opinii. Wypróbowałeś(-aś) go już? Bądź pierwszy(-a) i powiedz o tym innym!

Dyskusja

Częste pytania

EMA
Supertrend
Supply & Demand
ATR
Moving Average
VWAP
Support & Resistance
Produkty dostępne za pośrednictwem cTrader Store, w tym boty handlowe, wskaźniki i wtyczki, dostarczane są przez deweloperów zewnętrznych i udostępniane wyłącznie w celach informacyjnych oraz w celu zapewnienia dostępu technicznego. cTrader Store nie jest brokerem i nie zapewnia doradztwa inwestycyjnego, nie udziela spersonalizowanych rekomendacji ani nie gwarantuje przyszłych wyników.

Więcej od tego autora
Wskaźnik
Volume
Key Levels
+4
Margin Zones its CME-based support/resistance levels from price extremes, helps traders spot entries and exits NKZ zones
Wskaźnik
Channel
Fibonacci
+5
Market maker levels from key price extremes — catch major reversals and corrections in one click. ver1.2
Wskaźnik
BOS
CHOCH
+5
MyZTrade High TF candle is a multi-timeframe visualisation tool that overlays completed higher-timeframe candles.

Możesz także polubić

Logo „heatmap kopie”
Najwyżej oceniane
4.2
(4)
$19
/
$29
Wskaźnik
AI
SMC
+13
Dynamic Liquidity Depth exposes hidden volume
Wskaźnik
Candle Timer & Strength Panel for cTrader Description: Candle Timer & Strength Panel is an advanced, always-visible over
Wskaźnik
It draws a step line that visualize the movement of H4. Particularly effective when trade on lower timeframe.
Wskaźnik
AI
ATR
+27
Support and Resistance with signals
Wskaźnik
ATR
Channel
Reversal Trap Probability Bands plots a dynamic volatility envelope around price & automatically detects "trap" reversal
Wskaźnik
Aggressive
Supertrend
+5
Stop trading with tunnel vision! 🚫 The Heat Map Dashboard is an institutional-grade visual trading assistant
Wskaźnik
ATR
RSI
+14
A metric that can set 1 to 3 groups of Bollinger Bands
Wskaźnik
BOS
CHOCH
+5
MyZTrade High TF candle is a multi-timeframe visualisation tool that overlays completed higher-timeframe candles.
Wskaźnik
BOS
CHOCH
+5
A professional-grade cTrader indicator for traders following the Inner Circle Trader (ICT) methodology.
Wskaźnik
Forex
BTCUSD
+11
Unlock trading precision with QQE! Dual QQE indicators with a Bollinger Bands zero line provide clear buy/sell signals.
Wskaźnik
Prop
Forex
+11
Ultimate Session Tool: Boxes, OR, KZs, PD Levels, Overlaps, Custom Lines & Names, Info Panel! Highly customizable 📉📈
Wskaźnik
Three ZigZag lines
Wskaźnik
Forex
Crypto
+6
The cTrader Chaos Reversals indicator brings high-quality reversal signals to traders.
Logo „Equity and Balance”
Najwyżej oceniane
4.4
(5)
$19
/
$20
Wskaźnik
Prop
Forex
+4
Displays real-time balance, equity, P&L, margin metrics directly on your charts.
Wskaźnik
Key Levels
Support & Resistance
Clean psychological round-number grid with native pip and point auto-scaling across Forex, Gold, Indices, and Crypto.
Logo „QX TradeDecision”
Najwyżej oceniane
4.5
(4)
$20
/
$22
Wskaźnik
ATR
Flag
+5
Decision panel with Buy/Sell scores, market bias, setup quality, trading cost and clear trade reasons.
Wskaźnik
ATR
Forex
+2
Trade fearlessly: auto-adjusts order blocks, manages risks, and ensures precision. Was Free for early users now -80%
Wskaźnik
Forex
Signal
+4
Gann Pivot Vision is an innovative analytical tool that combines classic pivot reversal levels and Gann geometry

Cena

Od 28/06/2025



















