Opis
DOSTĘPNA ULEPSZONA WERSJA TUTAJ
Szukasz czegoś więcej niż tylko nakładek na natywne interwały czasowe? Ulepszony Custom Timeframes rozszerza tę koncepcję o potężne dodatki:
- Niestandardowe okresy (5H, 7H, 9H-23H, 25m, 35m, 50m, 55m, 4-dniowe, 2-tygodniowe, 3-tygodniowe, wielomiesięczne, wieloletnie)
- Linie OHLC z kontrolą przesunięcia słupka dla zakończonych lub formujących się słupków
- Siedem poziomów Fibonacciego (11,4% do 88,6%) z podświetleniem strefy równowagi
- Średnie kroczące obliczane bezpośrednio na strukturze niestandardowego interwału czasowego (9 typów MA, 8 źródeł cen)
- Przyciski przełączania do szybkiego zarządzania funkcjami.
Jeśli potrzebujesz okresów pomiędzy standardowymi interwałami wykresu z pełną nakładką analizy technicznej, sprawdź ulepszoną wersję.
__________________________________________________________________________________________
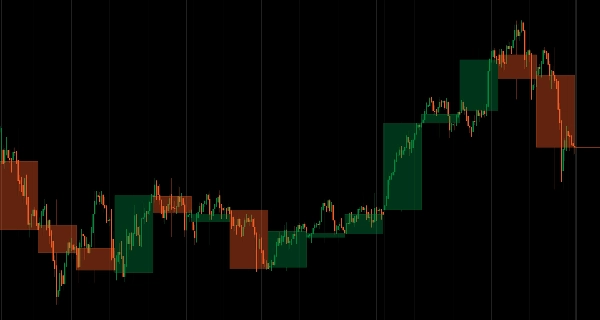
Nakładaj świece HTF w czasie rzeczywistym na dowolny wykres bez zmiany interwałów czasowych.
Wyświetla strukturę świec wyższego interwału czasowego (korpus i knoty) bezpośrednio na wykresach niższego interwału z aktualizacjami na żywo w miarę postępu okresu.
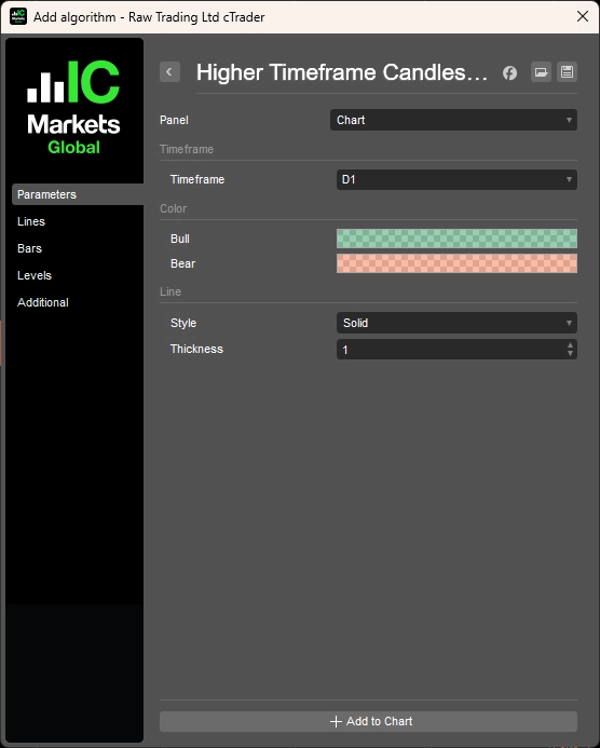
Elastyczny wybór interwałów czasowych (Dzienny na H1, Tygodniowy na H4, Miesięczny na Dziennym), kodowanie kolorami dla byków/niedźwiedzi (zielony/czerwony), konfigurowalny styl linii i przezroczystość oraz lekka wydajność zapewniają ciągły kontekst HTF dla traderów monitorujących strukturę na wielu interwałach bez przełączania wykresów.
CECHY
Elastyczny wybór interwału czasowego
- Dowolny HTF: Dzienny na H1, Tygodniowy na H4, Miesięczny na Dziennym — do wyboru
- Aktualizacje w czasie rzeczywistym: świeca HTF odrysowuje się w miarę postępu okresu
- Zawsze widoczne: handluj na niższych interwałach, zachowując kontekst wyższego interwału
Przejrzystość wizualna
- Kodowanie kolorami: Byki (zielony), Niedźwiedzie (czerwony) — natychmiastowe potwierdzenie nastawienia
- Konfigurowalne: styl linii, grubość, przezroczystość
- Czysta prezentacja: korpus i knoty wyraźnie wyświetlane
Prosta integracja
- Brak potrzeby zmiany interwału czasowego
- Zachowuje kontekst wykresu podczas wyświetlania struktury HTF
- Lekki i zoptymalizowany pod kątem wydajności
__________________________________________________________________________________________
WIĘCEJ DARMOWYCH WSKAŹNIKÓW
Odkryj szeroki zakres narzędzi analizy rynku — od struktury i wolumenu po regresję, zmienność i niestandardowe interwały czasowe.
Kod źródłowy jest dostępny w repozytorium GitHub repository.
Wszystko dostępne za darmo. Ale jeśli chcesz wesprzeć kawą, możesz to zrobić tutaj.
Wsparcie/Oporność
Wolumen
- Profiler Aktywności Wolumenu
- Analizator Efektywności Wolumenu
- Analiza Profilu Wolumenu
- Profil Wolumenu - Aktualizacja
- Analiza Rozkładu Wolumenu
- VWAP (Średnia ważona wolumenem)
Średnie kroczące
- Zakotwiczona średnia krocząca
- Średnia krocząca skalowana odchyleniem
- Natychmiastowa linia trendu
- Adaptacyjna MA Kaufmana z Trend Vision
- Kanał średnich kroczących
- Pakiet średnich kroczących
- Średnia krocząca kanału trendu
Narzędzia/niestandardowe
Oparte na regresji
Zmienność
Oscylatory
__________________________________________________________________________________________
ZASTRZEŻENIE
Trading wiąże się z ryzykiem. Ten wskaźnik jest przeznaczony wyłącznie do analizy technicznej — zawsze stosuj odpowiednie zarządzanie ryzykiem i handluj odpowiedzialnie.
OPINIE I ULEPSZENIA
Jeśli masz sugestie, prośby o funkcje lub pomysły na ulepszenia, zostaw komentarz na karcie Dyskusja. Twoja opinia pomaga ulepszyć wskaźnik dla wszystkich.