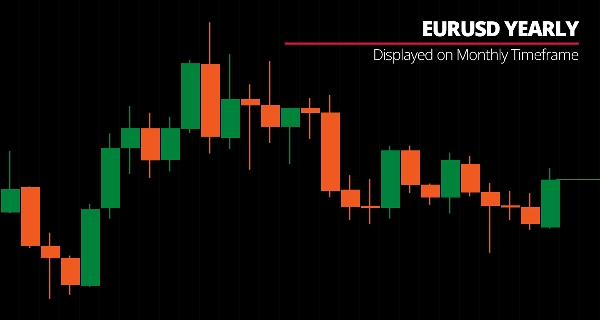
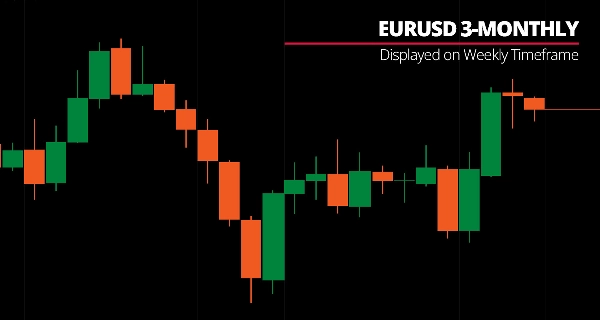
Brokerzy i firmy proptradingowe
Dla firm
00
Days
:
00
Hours
:
00
Minutes
:
00
Seconds
Wskaźnik
Indices
Commodities
Stocks
Forex
Crypto
Custom Timeframes
5.0
20/12/2025
38
Desktop
Od 20/12/2024
Bezpłatne instalacje
1208
Przesłany obraz „Custom Timeframes”Przesłany obraz „Custom Timeframes”Przesłany obraz „Custom Timeframes”Przesłany obraz „Custom Timeframes”Przesłany obraz „Custom Timeframes”Przesłany obraz „Custom Timeframes”Przesłany obraz „Custom Timeframes”Przesłany obraz „Custom Timeframes”Przesłany obraz „Custom Timeframes”Przesłany obraz „Custom Timeframes”

Display cTrader native timeframes and non-standard periods (5H, 7H, 9H, 4-day, 2-weekly, 3-monthly, yearly) with OHLC lines, moving averages, and Fibonacci levels.


Renders custom period candlesticks on any chart—from 25-minute bars to yearly periods—with full technical analysis overlaid on your custom timeframe.

Comprehensive period options (custom minutes/hours/days/weeks/months), visual bull/bear candlesticks with configurable wick thickness, OHLC line display with bar offset control (-1 completed, 0 forming), seven Fibonacci levels (11.4% to 88.6%) with 38.2%-61.8% equilibrium zone, nine MA types on eight price sources calculated on custom timeframe structure, and toggle controls for rapid feature management deliver flexible multi-timeframe analysis for traders needing periods between standard chart intervals.


Features


Comprehensive Period Options

  • Custom Minute Periods: 25m, 35m, 50m, 55m
  • Custom Hourly Periods: 5H, 7H, 9H-23H (every hour from 5 to 23)
  • Custom Daily/Weekly/Monthly: 4-day, 2-weekly, 3-weekly, 2-monthly, 3-monthly, 4-monthly, 6-monthly, yearly
  • Native Timeframes: All standard periods (m1-Monthly) with enhanced visualization


Custom Timeframe Bars

  • Visual candlesticks for custom periods with bull/bear coloring
  • Configurable wick thickness
  • Clean chart visualization—hide native bars, show only custom period structure
  • Real-time formation tracking


OHLC Lines

  • Display Open/High/Low/Close lines for custom timeframe bars
  • Bar offset control (-1 = last completed bar, 0 = forming bar)
  • Line extension: Extend to current bar or stop at bar close
  • Clear structural reference points


Fibonacci Levels

  • 7 levels (11.4%, 23.6%, 38.2%, 50%, 61.8%, 78.6%, 88.6%) based on custom bar range
  • Equilibrium Zone: Shaded area between 38.2%-61.8% levels
  • Dynamic levels that update with each custom period bar


Moving Average

  • Calculated on custom timeframe price
  • 9 MA types available
  • 8 price types for calculation source
  • Adaptive to custom period structure


Toggle Controls

  • Quick on/off buttons for custom bars, OHLC lines, MA
  • Clean interface for rapid feature management
  • Flexible display configuration


__________________________________________________________________________________________


More Free Indicators


Check out my other indicators—each one built with production-level code quality and practical features traders actually need.

All free to use. But if you feel like sending coffee support, you can route it to tinyurl(dot)com/coffee-supply


Moving Averages


Regression-Based


Support/Resistance


Volatility


Volume


Utilities/Custom


__________________________________________________________________________________________


Disclaimer

Trading involves risk. This indicator is intended for technical analysis only — always apply proper risk management and trade responsibly.


Feedback & Improvements

If you have suggestions, feature requests, or ideas for enhancement, please leave a comment in the Discussion tab. Your feedback helps improve the indicator for everyone.

5.0
Opinie: 1
5
100 %
4
0 %
3
0 %
2
0 %
1
0 %
Opinie klientów
December 1, 2025
Custom Timeframes creates non-standard bar intervals like M2, M10, H2, H3, giving traders cleaner structure and more flexibility. Stable and accurate, with light-to-moderate load on heavy markets. Great for SMC, trend models and custom strategies. A UI panel and caching would make it even better.
Więcej od tego autora
VWAP (Volume Weighted Average Price)
Customizable VWAP with flexible reset, three band methods, and full Fibonacci level control.
Fair Value Gap
FVG Detector: Identify and label Fair Value Gaps, with age, status & multi-timeframe support.
Wskaźnik
Fibonacci
Simple Pivot Points
Clear pivot levels. Clean S/R zones. Five methods. Any timeframe.
Volume Profile Analytics
Volume distribution analysis with Market Profile TPO integration.
Wskaźnik
FVG
Fibonacci
Fair Value Gap (Extended)
Detect FVGs with age, status, Fibonacci levels, and customizable fill threshold—extended version.
Wskaźnik
Breakout
Higher Timeframe Candlestick
Overlay a real-time higher-timeframe candle on your chart — color-coded bias without switching TFs.
Wskaźnik
Breakout
Round Number
Plots automatic psychological levels at round-number zones – major structure & liquidity levels.
Wskaźnik
Bollinger
Trend Channel Moving Average
Complete MA-channel system: colored trend, channel boundaries & equilibrium with 6 Fib zones.
Wskaźnik
Breakout
Fibonacci
Linear Regression Channel
Statistically-grounded trend channels via linear regression — clear trend & reversal zones.
Wskaźnik
Breakout
Fibonacci
Initial Balance
Track Initial Balance ranges across any period with optional Fibonacci levels and projections.
Wskaźnik
Scalping
Nadaraya-Watson Kernel Regression
Ultra-smooth adaptive trend line via Gaussian kernel regression — low lag, clean structure.
Wskaźnik
Scalping
Kaufman Adaptive MA with Trend Vision
Adaptive KAMA: fast in trend, slow in noise — with color-coded market state visualization.
Wskaźnik
Indices
Commodities
Stocks
+2
Moving Averages Suite
28-method MA library in one indicator — from classic EMAs to adaptive & zero-lag variants.
Wskaźnik
Indices
Stocks
Commodities
+2
Moving Average Channel
Price channel system built on moving averages—track trend direction, momentum shifts, and mean reversion zones.
Wskaźnik
Breakout
ATR
Scalping
Trend Volatility Trail
A volatility-adaptive trend-following indicator that dynamically adjusts to market conditions.
Wskaźnik
Fibonacci
Advanced Regression Channel
Regression channels with Fibonacci levels across multiple regression types, timeframes, and custom date ranges.
Wskaźnik
Fibonacci
Anchored Moving Average
Anchor a moving average to any point on the chart and watch it extend dynamically as price evolves.
Wskaźnik
Indices
Stocks
Commodities
+2
Deviation-Scaled Moving Average
Momentum-adaptive MA: scales responsiveness via deviation — fast in trend, smooth in chop.
Możesz także polubić
Wskaźnik
NAS100
NZDUSD
XAUUSD
+16
Swing AVWAP Pro
Adaptive Swing-Anchored VWAP that tracks market structure shifts with precision and clarity.
Wskaźnik
Breakout
Stocks
Signal
Darvas Box
The Darvas Box involves identifying "boxes" or trading ranges where a stock's price consolidates before breaking out.
Wskaźnik
NAS100
NZDUSD
Breakout
+12
Initial Balance Breakout Signals
📈 Initial Balance Breakout Signals: visually accurate IB levels, breakout alerts & forecast zones for smart trading.
Wskaźnik
NZDUSD
Breakout
FVG
+7
SmartMoneyConceptsIndicator
Automatically displays "Smart Money Concepts" used by professional traders.
Sharpe Ratio
Sharp Rate Indikator
IR CheckList
you could put your check list in your chart you could split your test with “,” you could put your checklist in indicat
Wskaźnik
NAS100
XAUUSD
FVG
+11
Fair Value Gaps_FVG_MTF
Multi-TF FVG + Smart Fibonacci
Wskaźnik
NAS100
NZDUSD
XAUUSD
+12
WT - Amplitude - Momentum Detection
Experience a new approach with amplitude-based momentum analysis. Smart Trend Detection That Adapts to Market Volatility
Wskaźnik
Grid
Indices
Prop
+4
Round Numbers
Automatically draws major, minor, and trace support/resistance levels at round numbers
ZigZagSmartAlert_demo
ZigZag Smart Alert DEMO for cTrader DEMO VERSION 24 hours free trial! This is a DEMO version of the ZigZag Smart Aler
Wskaźnik
Breakout
ATR
Forex
+2
RangeFilter FREE Adaptive PriceFilter lite version
Lightweight adaptive filter with dynamic bands. Clean, noise-free trend structure.
Wskaźnik
Breakout
BreakOut_Probability_Expo
Break Out Probability Experimental indicator. Credits for this indicator goes to Zeiierman !!!
Momentum Trend Analyzer
Provides comprehensive trend and momentum analysis by combining EMAs, RoC, normalized ATR, RSI, and volume..
Wskaźnik
Indices
Prop
Breakout
+3
RVI
A precision-crafted indicator that compares current volume to its historical average for the same time of day.
Wskaźnik
NAS100
NZDUSD
XAUUSD
+13
SupportResistance
Auto-detect support and resistance & trendlines, highlight pullbacks/BOS retests, and filter with candle confirmation.
Fx4U.Multi Trend Line Indicator
Allow trader to draw multi trendlines in different timeframes on one chart,Give trader an overview of the current market
Wskaźnik
Indices
Breakout
XAUUSD
+5
Price Action Context Scanner
Smart Price Action Scanner 🔍 Detects engulfing, pin bars & inside bars with trend filter for cleaner entries ✅
Fibonacci Pitchfan
Powerful all-in-one tool for traders seeking a clear, dynamic view of market structure. By merging pivots, trendlines &