説明
概要
ボリュームスプレッド分析(VSA)は、元シンジケートトレーダーのトム・ウィリアムズによって開発された手法で、1900年代初頭のリチャード・ワイコフの研究に基づいています。VSAは、ボリューム、価格のスプレッド(レンジ)、終値の位置関係を解釈し、需給の不均衡を特定します。
VSAの主要概念:
- ボリューム は活動量を示し、誰が参加しているかを表します
- スプレッド はボラティリティと不確実性を示し、価格がどれだけ動いたかを表します
- 終値の位置 はバーで勝ったのが買い手か売り手かを示します
- コンテキスト は市場サイクルのどこにいるかを示し、強気または弱気のフェーズを表します
ボリュームが増加しスプレッドが広いが価格の進展が少ない場合、それは吸収(片方がもう一方の圧力を吸収していること)を示唆します。トレンド中にボリュームが減少しスプレッドが狭い場合、それは参加不足(潜在的な弱さ)を示唆します。
この実装について:
このインジケーターは統計的手法を用いてVSAの概念を定量化しています。従来のVSAとはいくつかの点で異なります:
- 効率性指標として
(close - open) / rangeを使用(元のVSAにはありません) - 吸収パターンは従来の「圧力吸収」ではなく「片方の勝利」を識別します
- ENR(Effort No Result)は効率性の閾値を用いて定量化;元のVSAはより解釈的です
- ボリューム平均にはトリム平均(外れ値に強い)を使用し、スプレッドにはパーセンタイルランクを使用
- 以下は含まれていません:ストッピングボリューム、アップスラスト、テスト、シェイクアウトパターン
これはVSAの概念に対する定量的でアルゴリズム的なアプローチです。従来のVSAはより解釈的でコンテキスト依存です。このインジケーターは単独のシグナルとしてではなく、多くの分析ツールの一つとして使用してください。
このインジケーターの機能
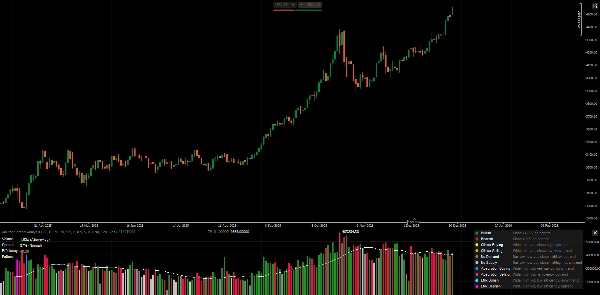
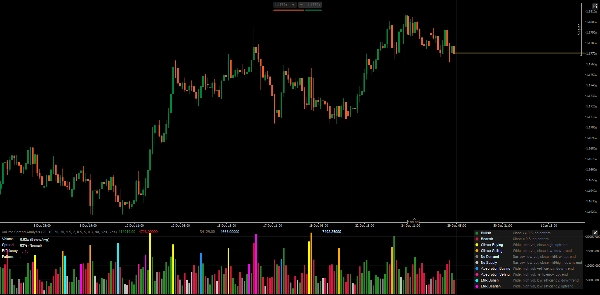
各バーのボリューム、スプレッド、終値の位置を分析し、潜在的な需給の不均衡を検出します。パターンタイプごとに色分けされたボリュームヒストグラムとリアルタイムのメトリクスパネルを表示します。
パターン定義
1. 標準バー(パターンなし)
- 強気: 終値がレンジの0.5以上、特別なパターンなし
- 弱気: 終値がレンジの0.5未満、特別なパターンなし
2. クライマックスパターン(潜在的な疲弊)
- クライマックス買い: 広いスプレッド+超高ボリューム+高終値+上昇トレンド中
-
- 解釈:買いの疲弊の可能性、反転に注意
- クライマックス売り: 広いスプレッド+超高ボリューム+低終値+下降トレンド中
-
- 解釈:売りの疲弊の可能性、反転に注意
3. 弱いパターン(確信の欠如)
- 需要なし: 狭いスプレッド+低ボリューム+中間/低終値+上昇トレンド中
-
- 解釈:買い手がラリーを支えていない、潜在的な弱さ
- 供給なし: 狭いスプレッド+低ボリューム+中間/高終値+下降トレンド中
-
- 解釈:売り手が下げを押していない、潜在的な強さ
4. 吸収パターン(片方の勝利)
- 吸収買い: 広いスプレッド+高ボリューム+正の効率性+下降トレンド中
-
- 解釈:買い手が売り圧力を吸収、反転上昇の可能性
- 吸収売り: 広いスプレッド+高ボリューム+負の効率性+上昇トレンド中
-
- 解釈:売り手が買い圧力を吸収、反転下落の可能性
5. ENRパターン(明確な結果のない努力)
- ENR強気: 広いスプレッド+高ボリューム+低効率性+下降トレンド中
-
- 解釈:努力は大きいが明確な勝者なし、潜在的なサポート/迷い
- ENR弱気: 広いスプレッド+高ボリューム+低効率性+上昇トレンド中
-
- 解釈:努力は大きいが明確な勝者なし、潜在的なレジスタンス/迷い
メトリクスパネルの説明
ボリューム
- 現在のバーのボリュームをトリム平均に対する比率(例:"1.85x")で表示
- 分類:低 / 平均以下 / 平均以上 / 高 / 超高
- 高ボリューム=市場参加、ただしコンテキストが重要
スプレッド
- 最近のバーに対するパーセンタイルランク(0-100%)を表示
- 分類:狭い / 通常 / 広い
- 広いスプレッド=ボラティリティ/不確実性、必ずしも方向性ではない
効率性
- 式:
(close - open) / (high - low) - 範囲:-1.0から+1.0
- 正の値=強気のボディがレンジを支配
- 負の値=弱気のボディがレンジを支配
- ゼロ近辺=小さなボディ、高いヒゲ、迷い
パターン
- 現在検出されたパターン(ない場合は「-」)
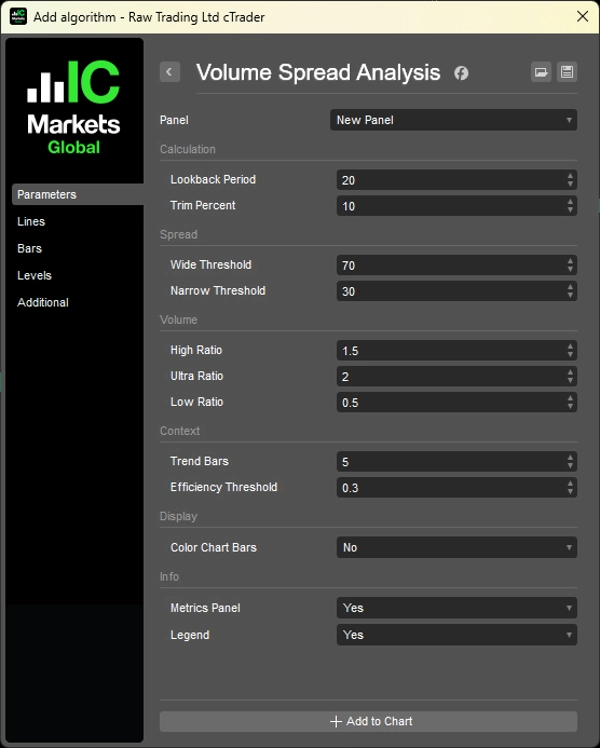
パラメーター
1. 計算
- ルックバック期間 (20):ボリューム/スプレッド統計に使用するバー数
- トリムパーセント (10%):ボリューム計算から外れ値を除去
2. スプレッド分類
- 広い閾値 (70%):「広い」と分類するパーセンタイル
- 狭い閾値 (30%):「狭い」と分類するパーセンタイル
3. ボリューム分類
- 高比率 (1.5x):平均以上の閾値
- 超高比率 (2.0x):超高閾値
- 低比率 (0.5x):平均以下の閾値
4. コンテキスト
- トレンドバー数 (5):トレンド方向を比較するための過去バー数
- 効率性閾値 (0.3):「強い」効率性の最小値
5. 表示
- チャートバーの色付け:パターン色を価格チャートに適用
- メトリクスパネル:リアルタイムのメトリクスを表示
- 凡例:パターンの参照ガイドを表示
使い方
1. パターンを直接の取引シグナルとして使用しないでください - 潜在的なコンテキストを示すものであり、エントリーではありません。
2. 価格構造と組み合わせて使用する - VSAは価格構造の確認に最適です。
3. コンテキストに注意する - 同じパターンでもサポートとレジスタンスで意味が異なります。
4. ボリュームの視点が重要 - 重要なレベルでの高ボリューム吸収はランダムなバー吸収より重要です。
FXのボリューム制限
FXスポット市場は ティックボリューム(価格変動回数)を示し、実際の取引契約数ではありません。パターンは真のボリュームデータを持つ先物や株式より信頼性が低い場合があります。
凡例(内蔵リファレンス)
「凡例」パラメーターを有効にすると、チャート上にパターン説明が直接表示されます。
__________________________________________________________________________________________
その他の無料インジケーター
構造やボリュームから回帰、ボラティリティ、カスタム時間枠まで幅広い市場分析ツールを探求してください。
ソースコードはGitHubの リポジトリで利用可能です。
すべて無料で使用できますが、コーヒーサポートを送りたい場合は こちらからどうぞ。
サポート/レジスタンス
ボリューム
移動平均
- SSLチャネル
- アンカード移動平均
- 偏差スケール移動平均
- ギャン高低アクティベーター
- 瞬時トレンドライン
- カウフマン適応MAとトレンドビジョン
- 移動平均チャネル
- 移動平均スイート
- トレンドチャネル移動平均
ユーティリティ/カスタム
回帰ベース
ボラティリティ
オシレーター
__________________________________________________________________________________________
免責事項
取引にはリスクが伴います。このインジケーターはテクニカル分析専用であり、常に適切なリスク管理を行い、責任を持って取引してください。
フィードバックと改善
ご提案、機能リクエスト、改善案があれば、ディスカッションタブにコメントを残してください。皆様のフィードバックはインジケーターの改善に役立ちます。
概要
This implementation quantifies VSA concepts using statistical methods, including an efficiency metric defined as (close - open) / range, trimmed mean volume averaging, and percentile ranking for spread. It identifies several bar patterns: Standard (bullish/bearish), Climax (buying/selling exhaustion), Weak (No Demand/No Supply), Absorption (one side winning), and ENR (Effort No Result), each indicating different market conditions.
The indicator displays a volume histogram colored by detected pattern type and provides a real-time metrics panel showing volume ratio, spread percentile, efficiency, and current pattern. Parameters allow customization of lookback periods, volume/spread thresholds, and display options such as coloring chart bars and showing a pattern legend.
VSA is applicable across markets including Forex, stocks, indices, commodities, and crypto. Note that Forex volume reflects tick volume, which may affect pattern reliability. The indicator is designed as an analytical tool to complement price structure analysis rather than as standalone trade signals.
カスタマーレビュー
5 | 100 % | |
4 | 0 % | |
3 | 0 % | |
2 | 0 % | |
1 | 0 % |


![「[CB] Pivot Points Pro」ロゴ](https://cdn.ctrader.com/image/webp/43463c82-67b0-4f10-a4ba-901bba091d81_32594)