
Descrição
Versão aprimorada com controle de limite de preenchimento parcial, rastreamento preciso da idade e níveis automáticos de Fibonacci em gaps.
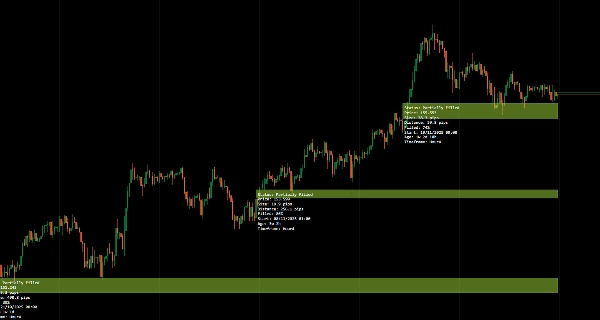
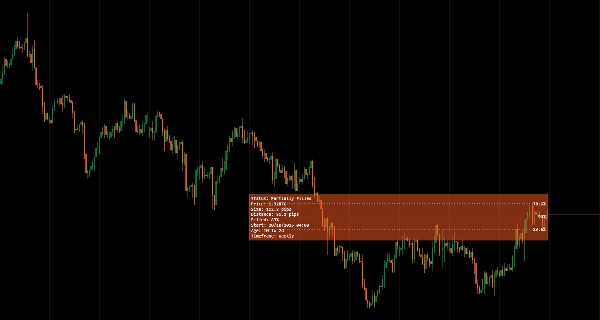
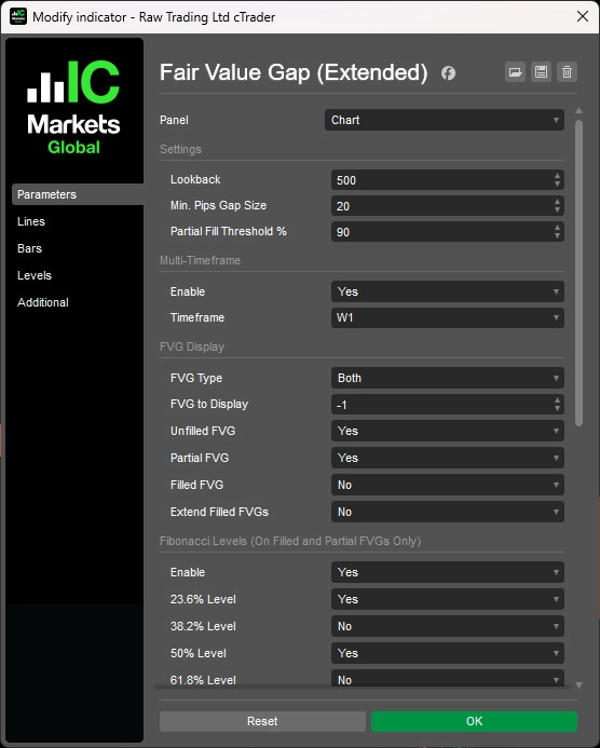
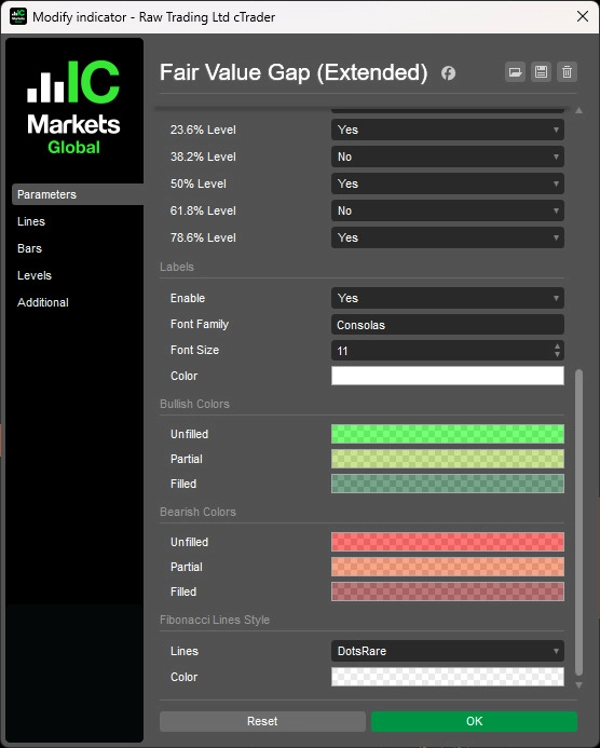
Detecta automaticamente gaps de alta e baixa com limite configurável de preenchimento parcial (50-99%, padrão 90%), exibe a idade do gap em formato anos/meses/semanas/dias e projeta cinco níveis de Fibonacci (23,6% a 78,6%) em FVGs parciais e preenchidos.
Varredura em múltiplos timeframes para alinhar gaps estruturais HTF com ação de preço LTF, opção para estender caixas FVG preenchidas até a barra atual, exibição ilimitada de gaps históricos (-1 configuração), atualizações dinâmicas de status (não preenchido/parcial/preenchido) e rotulagem mínima e não intrusiva oferecem análise abrangente de desequilíbrio de liquidez para traders que buscam preenchimentos de gaps com zonas de entrada baseadas em Fibonacci.
RECURSOS
Identificação Aprimorada de FVG
- Encontra automaticamente Fair Value Gaps de alta e baixa
- Rastreia status não preenchido, parcialmente preenchido e totalmente preenchido em tempo real
- Limite de Preenchimento Parcial: Controla quando o preenchimento parcial se torna preenchimento total (50-99%, padrão 90%)
- Plotagem visual limpa com mínima desordem no gráfico
Exibição Aprimorada da Idade
- Mostra a idade precisa do gap em anos, meses, semanas e dias (ex.: "3a 2s 4d")
- Ajuda a priorizar gaps frescos vs. antigos para seleção de trades
- Contexto temporal melhora a tomada de decisão sobre a relevância do gap
Rastreamento e Exibição de Status
- Mostra status atual de preenchimento: não preenchido, parcialmente preenchido ou totalmente preenchido
- Atualiza dinamicamente conforme o preço interage com o gap
- Confirmação visual da captura de liquidez
- Estender FVGs Preenchidos: Opção para estender caixas FVG preenchidas até a barra atual para referência
Níveis de Fibonacci
- Níveis automáticos de Fibonacci (23,6%, 38,2%, 50%, 61,8%, 78,6%) exibidos em FVGs parciais e preenchidos
- Elimina a necessidade de desenhar níveis manualmente
- Zonas de entrada precisas dentro dos gaps
- Estratégias de entrada baseadas em Fibonacci simplificadas
Modo Multi-Timeframe
- Varre e exibe FVGs de timeframe superior em gráficos de timeframe inferior
- Alinha gaps estruturais HTF com ação de preço LTF
- Melhora o fluxo de trabalho de análise multi-timeframe
Mostrar Todos os FVGs
- Defina "FVG para Exibir" como -1 para mostrar todos os FVGs históricos sem limite
- Visibilidade completa do comportamento dos gaps em seu gráfico
- Rastreia padrões de preenchimento de gaps ao longo do tempo
Interface Limpa e Minimalista
- Rótulos não intrusivos projetados para clareza
- Informativo sem poluir sua visão de preço
- Apresentação profissional para análise focada
__________________________________________________________________________________________
MAIS INDICADORES GRATUITOS
Explore uma ampla gama de ferramentas de análise de mercado — desde estrutura e volume até regressão, volatilidade e timeframes personalizados.
O código-fonte está disponível no repositório GitHub.
Todos gratuitos para usar. Mas se quiser enviar um suporte para café, você pode fazê-lo aqui.
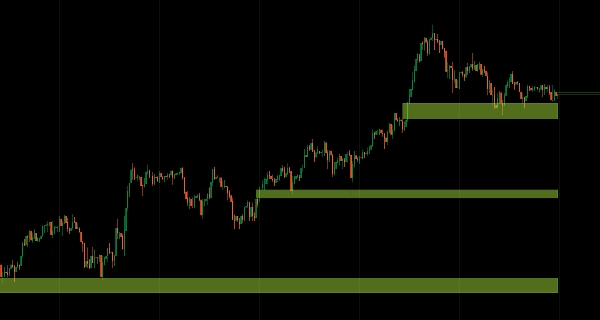
Suporte/Resistência
Volume
- Volume Activity Profiler
- Volume Efficiency Analyzer
- Volume Profile Analytics
- Volume Profile - Updated
- Volume Spread Analysis
- VWAP (Volume Weighted Average Price)
Médias Móveis
- SSL Channel
- Anchored Moving Average
- Deviation-Scaled Moving Average
- Gann High Low Activator
- Instantaneous Trendline
- Kaufman Adaptive MA with Trend Vision
- Moving Average Channel
- Moving Averages Suite
- Trend Channel Moving Average
Utilitários/Personalizados
Baseado em Regressão
Volatilidade
Osciladores
__________________________________________________________________________________________
ISENÇÃO DE RESPONSABILIDADE
Negociar envolve riscos. Este indicador destina-se apenas à análise técnica — sempre aplique gerenciamento de risco adequado e negocie com responsabilidade.
FEEDBACK E MELHORIAS
Se você tiver sugestões, pedidos de recursos ou ideias para aprimoramento, por favor deixe um comentário na aba Discussão. Seu feedback ajuda a melhorar o indicador para todos.
Resumo
The indicator displays the precise age of each gap in years, months, weeks, and days, aiding traders in prioritizing fresh versus stale gaps. It projects five Fibonacci retracement levels (23.6%, 38.2%, 50%, 61.8%, 78.6%) on partial and filled gaps, providing predefined entry zones based on Fibonacci ratios without manual drawing.
Fair Value Gap (Extended) supports multi-timeframe analysis by scanning higher timeframe gaps and displaying them on lower timeframe charts, facilitating alignment of structural gaps with price action. It offers options to extend filled gap boxes to the current bar and to display unlimited historical gaps for comprehensive gap behavior tracking.
The indicator features a clean, minimal user interface with non-intrusive labels, delivering clear liquidity imbalance insights for traders focusing on gap fills and Fibonacci-based entries.
Avaliações de clientes
5 | 100 % | |
4 | 0 % | |
3 | 0 % | |
2 | 0 % | |
1 | 0 % |


![Logótipo de "High-Low Divergence [Iridio Capital]"](https://cdn.ctrader.com/image/webp/443c4661-7abb-40f1-842f-4b6ec560649b_40914)


![Logótipo de "[Hamster-Coder] Price"](https://cdn.ctrader.com/image/webp/893fb641-d5b3-44d8-91fb-6a2dc6f3d309_30647)


