Descrição
VISÃO GERAL
Fundamento: Princípios de Wyckoff
Este indicador é construído com base em dois conceitos complementares da metodologia Wyckoff:
1. Esforço vs Resultado
O princípio central de Wyckoff afirma que o movimento do preço (resultado) deve ser proporcional ao volume por trás dele (esforço). Quando esforço e resultado estão em harmonia, o mercado está se comportando normalmente. Quando divergem, sinaliza potenciais pontos de reversão ou força de continuação.
Este indicador implementa isso diretamente através da métrica Eficiência (resultado por unidade de esforço) e seu inverso, Absorção (esforço que não se traduz em resultado).
2. Análise do Spread
Wyckoff também enfatizou a análise do caráter das barras de preço individuais—examinando o spread (faixa), onde o preço fechou dentro dessa faixa, e se a barra mostrou compromisso ou indecisão.
Este indicador implementa a análise do spread através da Convicção (compromisso direcional), Taxa Desperdiçada (retracement dentro da barra), e Posição de Fechamento (usada para contextualizar absorção como acumulação ou distribuição).
O QUE ESTE INDICADOR FAZ
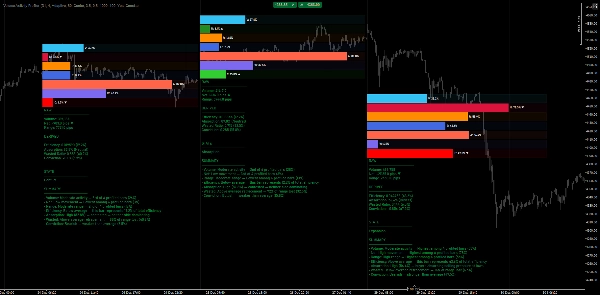
O Volume Activity Profiler analisa barras de preço de um período selecionado e divide sua atividade em componentes mensuráveis. Ele calcula métricas brutas e métricas derivadas baseadas em percentis, depois as exibe como gráficos de barras horizontais ancorados abaixo de cada barra analisada.
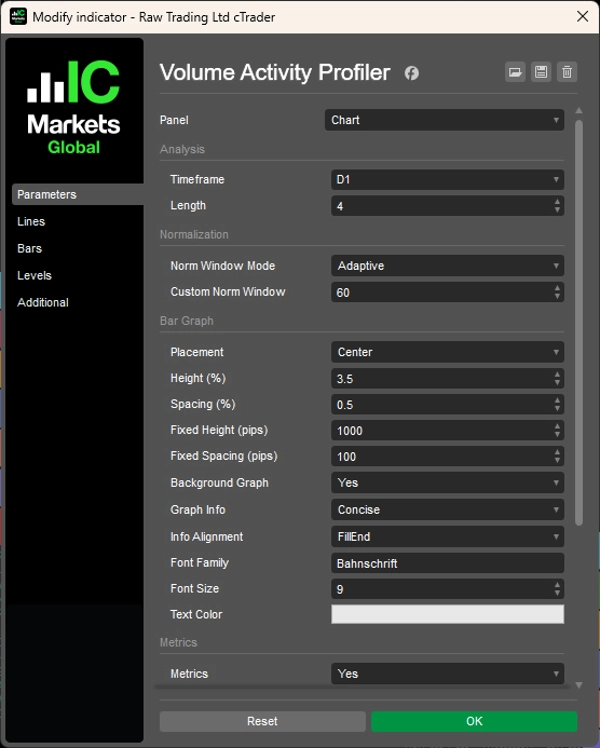
Você configura dois parâmetros principais:
- Período: O período para analisar (ex.: Semanal, Diário, H4)
- Comprimento: Quantas barras perfilar (ex.: últimas 4 barras)
O indicador então perfila cada barra dentro desse escopo, calculando métricas e classificando-as entre si e contra normas históricas.
MÉTRICAS EXPLICADAS
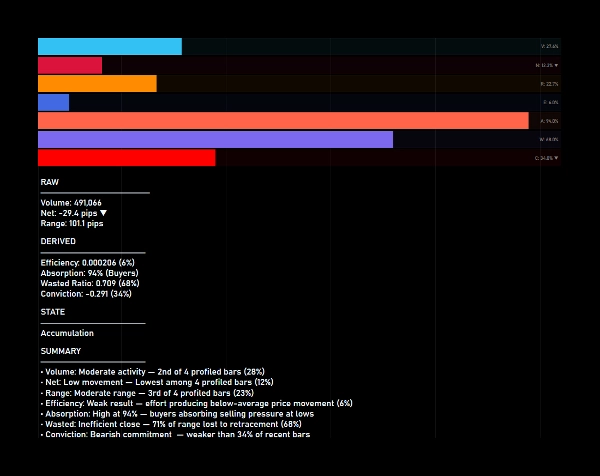
Métricas Brutas (baseadas em proporção entre barras perfiladas):
1. Volume
Volume de ticks da barra. Mostra qual proporção do volume total perfilado esta barra representa.
2. Líquido
Movimento direcional (fechamento − abertura) em pips. Mostra a proporção do movimento líquido total. A cor indica a direção (verde = alta, vermelho = baixa).
3. Faixa
Faixa total de preço (máximo − mínimo) em pips. Mostra a proporção da faixa total entre as barras perfiladas.
Métricas Derivadas (baseadas em percentis contra janela histórica):
1. Eficiência (Esforço vs Resultado)
Faixa produzida por unidade de volume. Alta eficiência significa que o esforço está se traduzindo em movimento de preço. Baixa eficiência sugere absorção ou resistência.
2. Absorção (Esforço vs Resultado)
Inverso da eficiência. Alta absorção indica que o volume está sendo absorvido sem movimento proporcional de preço—potencial acumulação ou distribuição.
3. Desperdício (Análise do Spread)
Percentual da faixa perdida para retração (faixa − líquido) / faixa. Alto desperdício significa que a barra devolveu grande parte do seu movimento. Baixo desperdício indica uma barra limpa e direcional.
4. Convicção (Análise do Spread)
Compromisso direcional medido como líquido/faixa. Alta convicção significa que a barra fechou perto do seu extremo. Baixa convicção indica indecisão ou rejeição.
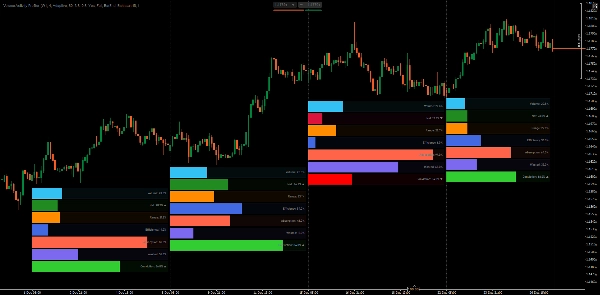
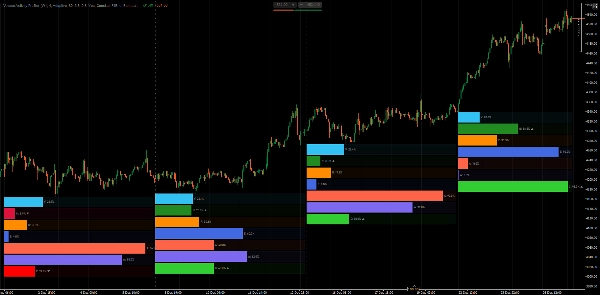
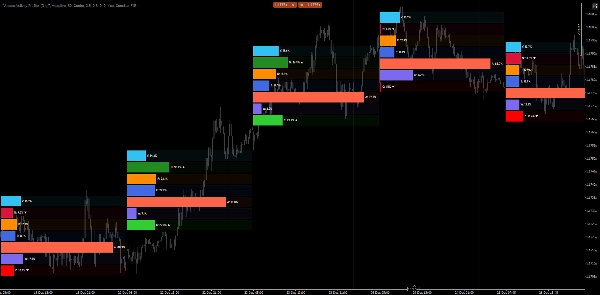
ENTENDENDO OS GRÁFICOS DE BARRAS
Cada barra perfilada exibe 7 barras horizontais:
- Volume, Líquido, Faixa — Preenchidas com base na proporção entre as barras perfiladas
- Eficiência, Absorção, Desperdício, Convicção — Preenchidas com base na classificação percentil contra dados históricos
Uma barra preenchida a 80% em Eficiência significa que a eficiência desta barra é maior que 80% das barras na janela de normalização.
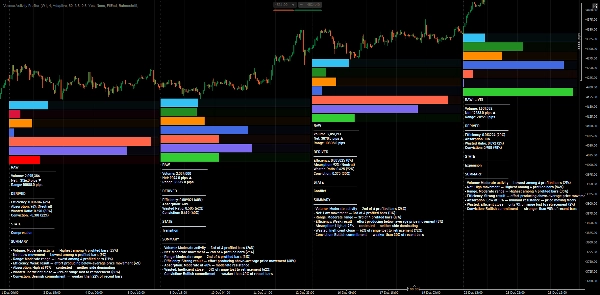
CLASSIFICAÇÃO DO ESTADO DE ATIVIDADE
Quando a exibição de Métricas está ativada, o indicador classifica cada barra em um destes estados:
1. Compressão
Baixa eficiência + baixa convicção — preço está se enrolando, energia potencial se acumulando
2. Expansão
Alta eficiência + alta convicção + baixo desperdício — movimento direcional forte
3. Conflito
Alto desperdício + baixa convicção — batalha entre compradores e vendedores
4. Acumulação
Alta absorção + fechamento perto das mínimas — compradores absorvendo pressão de venda
5. Distribuição
Alta absorção + fechamento perto das máximas — vendedores absorvendo pressão de compra
6. Rejeição
Alta convicção mas fechamento oposto à direção — movimento falho, potencial reversão
7. Transição
Sinais mistos — mercado em transição entre estados
BENEFÍCIOS PRÁTICOS
- Avaliação rápida de esforço vs resultado — Veja instantaneamente se o volume está produzindo movimento proporcional ou sendo absorvido.
- Análise de estrutura multi-temporal — Analise barras de períodos maiores enquanto permanece no seu período de execução.
- Identifique acumulação/distribuição — Alta absorção com posicionamento de fechamento revela onde grandes players podem estar ativos.
- Detecte exaustão e rejeição — Alta convicção com posição de fechamento oposta alerta para potenciais reversões.
- Compare barras objetivamente — Rankings e percentis removem subjetividade das avaliações de volume "alto" ou "baixo".
- Confirme rompimentos — Estado de expansão com alta eficiência e convicção confirma interesse genuíno no rompimento.
VOLUME DE TICKS COMO PROXY DE ESFORÇO
Este indicador usa volume de ticks como entrada de esforço. No forex, o volume de ticks representa a frequência de mudança de preço em vez do volume real negociado—uma limitação conhecida dos mercados descentralizados.
Apesar disso, o volume de ticks serve efetivamente como proxy de esforço porque:
- Reflete a atividade relativa do mercado entre barras
- Altas contagens de ticks indicam maior engajamento dos participantes
- A relação esforço vs resultado se mantém—alta atividade produzindo pouco movimento ainda sinaliza absorção
As classificações percentis e comparações de barras do indicador permanecem válidas enquanto os dados forem consistentes.
NOTAS
- O indicador usa janelas de normalização adaptativas baseadas no período quando configurado para modo Adaptativo, garantindo contexto histórico relevante.
- Cálculos percentis atualizam apenas em barras completas para evitar leituras instáveis em barras em formação.
- A barra atual em formação é marcada com [LIVE] no painel de métricas.
__________________________________________________________________________________________
MAIS INDICADORES GRATUITOS
Explore uma ampla gama de ferramentas de análise de mercado—desde estrutura e volume até regressão, volatilidade e períodos personalizados.
O código-fonte está disponível no repositório do GitHub repository.
Todos gratuitos para usar. Mas se quiser enviar um suporte para café, você pode direcionar aqui.
Suporte/Resistência
Volume
- Volume Activity Profiler
- Volume Efficiency Analyzer
- Volume Profile Analytics
- Volume Profile - Updated
- Volume Spread Analysis
- VWAP (Volume Weighted Average Price)
Médias Móveis
- SSL Channel
- Anchored Moving Average
- Deviation-Scaled Moving Average
- Gann High Low Activator
- Instantaneous Trendline
- Kaufman Adaptive MA with Trend Vision
- Moving Average Channel
- Moving Averages Suite
- Trend Channel Moving Average
Utilitários/Personalizados
Baseado em Regressão
Volatilidade
Osciladores
__________________________________________________________________________________________
AVISO LEGAL
Negociar envolve riscos. Este indicador destina-se apenas à análise técnica — sempre aplique gestão de risco adequada e negocie com responsabilidade.
FEEDBACK E MELHORIAS
Se você tiver sugestões, pedidos de recursos ou ideias para aprimoramento, por favor deixe um comentário na aba Discussão. Seu feedback ajuda a melhorar o indicador para todos.
Resumo
The indicator profiles price bars over a user-selected timeframe and length, calculating raw metrics such as Volume (tick volume proportion), Net (directional price movement), and Range (price range). It also derives percentile-based metrics including Efficiency (price movement per volume unit), Absorption (volume without proportional price change), Wasted Ratio (retracement within the bar), and Conviction (directional commitment).
These metrics are visually represented as horizontal bar graphs beneath each analyzed bar, facilitating objective comparison and historical context. The indicator classifies bars into activity states like Compression, Expansion, Conflict, Accumulation, Distribution, Rejection, and Transition, aiding in identifying market phases and potential turning points.
Volume Activity Profiler uses tick volume as an effort proxy, reflecting relative market activity. It supports multi-timeframe analysis and updates percentile rankings on completed bars to ensure stable readings. This tool assists traders in assessing volume efficiency, spotting accumulation/distribution, confirming breakouts, and understanding market structure through quantitative volume and price bar analysis.
Avaliações de clientes
5 | 100 % | |
4 | 0 % | |
3 | 0 % | |
2 | 0 % | |
1 | 0 % |