Descrição
VISÃO GERAL
Análise de Spread de Volume (VSA) é uma metodologia desenvolvida por Tom Williams, um ex-trader de sindicato, baseada no trabalho de Richard Wyckoff do início dos anos 1900. O VSA interpreta a relação entre volume, spread de preço (intervalo) e localização do fechamento para identificar desequilíbrios de oferta e demanda.
Conceitos-chave do VSA:
- Volume mostra a quantidade de atividade - quem está participando
- Spread mostra volatilidade e incerteza - o quanto o preço se moveu
- Localização do Fechamento mostra quem venceu a barra - compradores ou vendedores
- Contexto mostra onde estamos no ciclo de mercado - fase de força ou fraqueza
Quando o volume aumenta com spread amplo mas pouco progresso no preço, sugere absorção (um lado absorvendo a pressão do outro). Quando o volume diminui com spread estreito em uma tendência, sugere falta de participação (potencial fraqueza).
Esta Implementação:
Este indicador quantifica os conceitos do VSA usando métodos estatísticos. Ele difere do VSA tradicional em vários aspectos:
- Usa
(close - open) / rangecomo métrica de eficiência (não presente no VSA original) - Padrões de absorção identificam "um lado vencendo" em vez da tradicional "absorção de pressão"
- ENR (Esforço Sem Resultado) é quantificado usando limiar de eficiência; o VSA original é mais interpretativo
- Usa média aparada para média de volume (resistente a outliers) e classificação percentílica para spread
- Não inclui: Volume de Parada, Upthrust, Teste, padrões de Shakeout
Esta é uma abordagem quantificada e algorítmica dos conceitos do VSA. O VSA tradicional é mais interpretativo e dependente do contexto. Use este indicador como uma das ferramentas analíticas, não como sinais isolados.
O QUE ESTE INDICADOR FAZ
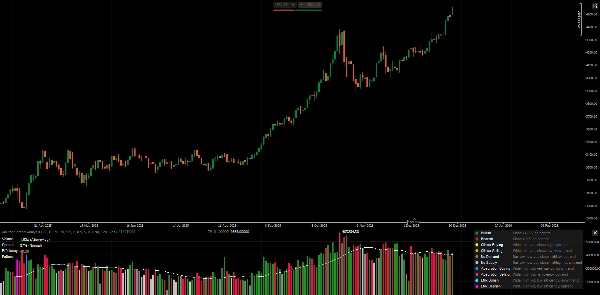
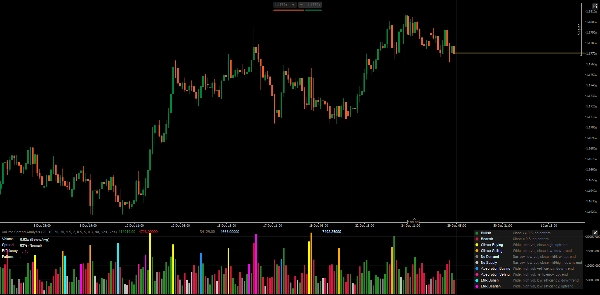
Analisa o volume, spread e localização do fechamento de cada barra para detectar potenciais desequilíbrios de oferta/demanda. Exibe histograma de volume colorido por tipo de padrão, com painel de métricas em tempo real.
DEFINIÇÕES DE PADRÕES
1. Barras Padrão (Sem Padrão)
- Altista: Fechamento ≥ 0,5 no intervalo, nenhum padrão especial detectado
- Baixista: Fechamento < 0,5 no intervalo, nenhum padrão especial detectado
2. Padrões de Clímax (Potencial Exaustão)
- Compra de Clímax: Spread amplo + volume ultra alto + fechamento alto + em tendência de alta
-
- Interpretação: Possível exaustão de compra, atenção para reversão
- Venda de Clímax: Spread amplo + volume ultra alto + fechamento baixo + em tendência de baixa
-
- Interpretação: Possível exaustão de venda, atenção para reversão
3. Padrões Fracos (Falta de Convicção)
- Sem Demanda: Spread estreito + volume baixo + fechamento médio/baixo + em tendência de alta
-
- Interpretação: Compradores não apoiando a alta, potencial fraqueza
- Sem Oferta: Spread estreito + volume baixo + fechamento médio/alto + em tendência de baixa
-
- Interpretação: Vendedores não pressionando para baixo, potencial força
4. Padrões de Absorção (Um Lado Vencendo)
- Absorção de Compra: Spread amplo + volume alto + eficiência positiva + em tendência de baixa
-
- Interpretação: Compradores absorvendo pressão de venda, potencial reversão para cima
- Absorção de Venda: Spread amplo + volume alto + eficiência negativa + em tendência de alta
-
- Interpretação: Vendedores absorvendo pressão de compra, potencial reversão para baixo
5. Padrões ENR (Esforço Sem Resultado Claro)
- ENR Altista: Spread amplo + volume alto + baixa eficiência + em tendência de baixa
-
- Interpretação: Alto esforço mas sem vencedor claro, potencial suporte/indecisão
- ENR Baixista: Spread amplo + volume alto + baixa eficiência + em tendência de alta
-
- Interpretação: Alto esforço mas sem vencedor claro, potencial resistência/indecisão
PAINEL DE MÉTRICAS EXPLICADO
Volume
- Mostra o volume da barra atual como razão em relação à média aparada (ex.: "1,85x")
- Classificação: Baixo / Abaixo da Média / Acima da Média / Alto / Ultra Alto
- Volume alto = participação no mercado, mas o contexto importa
Spread
- Mostra a classificação percentílica (0-100%) em relação às barras recentes
- Classificação: Estreito / Normal / Amplo
- Spread amplo = volatilidade/incerteza, não necessariamente direção
Eficiência
- Fórmula:
(close - open) / (high - low) - Intervalo: -1,0 a +1,0
- Positivo = corpo altista domina o intervalo
- Negativo = corpo baixista domina o intervalo
- Próximo de zero = corpo pequeno, sombra alta, indecisão
Padrão
- Padrão detectado atual (ou "-" se nenhum)
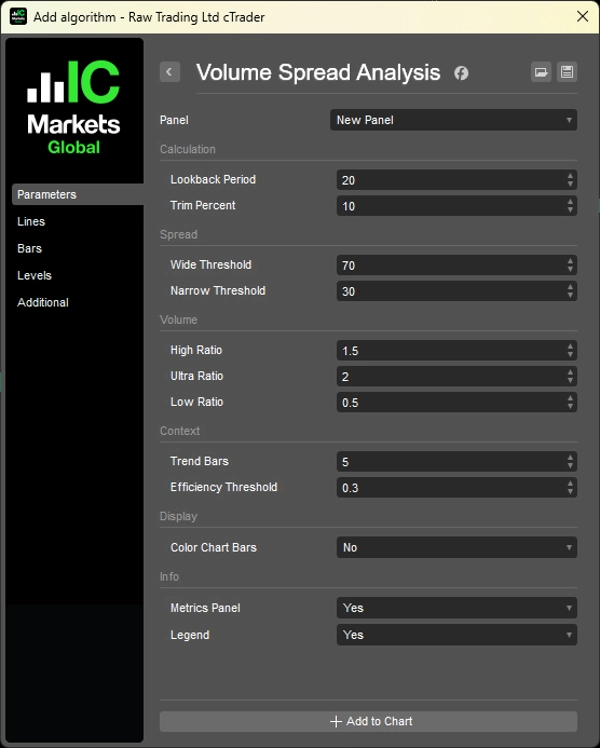
PARÂMETROS
1. Cálculo
- Período de Retrospectiva (20): Barras usadas para estatísticas de volume/spread
- Percentual de Aparagem (10%): Remove outliers do cálculo de volume
2. Classificação de Spread
- Limiar Amplo (70%): Percentil para classificar como "amplo"
- Limiar Estreito (30%): Percentil para classificar como "estreito"
3. Classificação de Volume
- Razão Alta (1,5x): Limiar acima da média
- Razão Ultra (2,0x): Limiar ultra alto
- Razão Baixa (0,5x): Limiar abaixo da média
4. Contexto
- Barras de Tendência (5): Barras anteriores para comparar direção da tendência
- Limiar de Eficiência (0,3): Mínimo para eficiência "forte"
5. Exibição
- Colorir Barras do Gráfico: Aplicar cores dos padrões ao gráfico de preços
- Painel de Métricas: Mostrar métricas em tempo real
- Legenda: Mostrar guia de referência dos padrões
COMO USAR
1. Não use padrões como sinais diretos de negociação - eles indicam potencial contexto, não entradas.
2. Combine com estrutura de preço - VSA funciona melhor confirmando o que a estrutura de preço mostra.
3. Observe o contexto - o mesmo padrão pode significar coisas diferentes em suporte vs resistência.
4. A perspectiva do volume importa - absorção de volume alto em nível chave > absorção de barra aleatória.
Limitação do Volume Forex
O mercado spot Forex mostra volume de ticks (número de mudanças de preço), não contratos realmente negociados. Os padrões podem ser menos confiáveis do que em futuros/ações com dados reais de volume.
LEGENDA (Referência Incorporada)
Ative o parâmetro "Legenda" para exibir descrições dos padrões diretamente no gráfico.
__________________________________________________________________________________________
MAIS INDICADORES GRATUITOS
Explore uma ampla gama de ferramentas de análise de mercado — desde estrutura e volume até regressão, volatilidade e períodos personalizados.
O código-fonte está disponível no repositório do GitHub repository.
Todos gratuitos para usar. Mas se quiser enviar um apoio para café, você pode fazer isso aqui.
Suporte/Resistência
Volume
- Volume Activity Profiler
- Volume Efficiency Analyzer
- Volume Profile Analytics
- Volume Profile - Updated
- Volume Spread Analysis
- VWAP (Volume Weighted Average Price)
Médias Móveis
- SSL Channel
- Anchored Moving Average
- Deviation-Scaled Moving Average
- Gann High Low Activator
- Instantaneous Trendline
- Kaufman Adaptive MA with Trend Vision
- Moving Average Channel
- Moving Averages Suite
- Trend Channel Moving Average
Utilitários/Personalizados
Baseado em Regressão
Volatilidade
Osciladores
__________________________________________________________________________________________
ISENÇÃO DE RESPONSABILIDADE
Negociar envolve riscos. Este indicador destina-se apenas à análise técnica — sempre aplique gestão de risco adequada e negocie com responsabilidade.
FEEDBACK E MELHORIAS
Se você tiver sugestões, pedidos de recursos ou ideias para aprimoramento, por favor deixe um comentário na aba Discussão. Seu feedback ajuda a melhorar o indicador para todos.
Resumo
This implementation quantifies VSA concepts using statistical methods, including an efficiency metric defined as (close - open) / range, trimmed mean volume averaging, and percentile ranking for spread. It identifies several bar patterns: Standard (bullish/bearish), Climax (buying/selling exhaustion), Weak (No Demand/No Supply), Absorption (one side winning), and ENR (Effort No Result), each indicating different market conditions.
The indicator displays a volume histogram colored by detected pattern type and provides a real-time metrics panel showing volume ratio, spread percentile, efficiency, and current pattern. Parameters allow customization of lookback periods, volume/spread thresholds, and display options such as coloring chart bars and showing a pattern legend.
VSA is applicable across markets including Forex, stocks, indices, commodities, and crypto. Note that Forex volume reflects tick volume, which may affect pattern reliability. The indicator is designed as an analytical tool to complement price structure analysis rather than as standalone trade signals.
Avaliações de clientes
5 | 100 % | |
4 | 0 % | |
3 | 0 % | |
2 | 0 % | |
1 | 0 % |