説明
任意の期間にわたるオープニングレンジ構造—日中セッションから年間サイクルまで—フィボナッチレベルと拡張予測を使用。
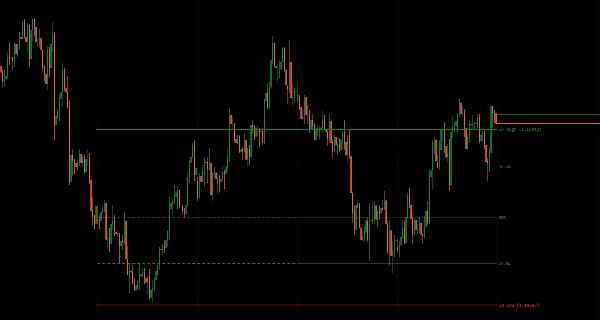
オープニング期間(日次、週次、月次、四半期、年次、またはカスタムレンジ)に確立された高値/安値レンジをブレイクアウト、平均回帰、ボラティリティの期待値の基準としてマークします。
タイムゾーン対応のセッション検出(シドニー/東京/ロンドン/NY)を備えた8つの期間タイプ、マルチ期間比較のための履歴オフセット、IBレンジ内の7つのオプションのフィボナッチレベル(11.4%から88.6%)、境界からの上向き/下向き予測、柔軟なライン拡張制御(IB期間のみ、現在のバー、またはN期間先)、および精密な期間検出により、すべてのタイムフレームで構造ベースのセットアップを目指すトレーダーに包括的なオープニングレンジ分析を提供します。
特徴
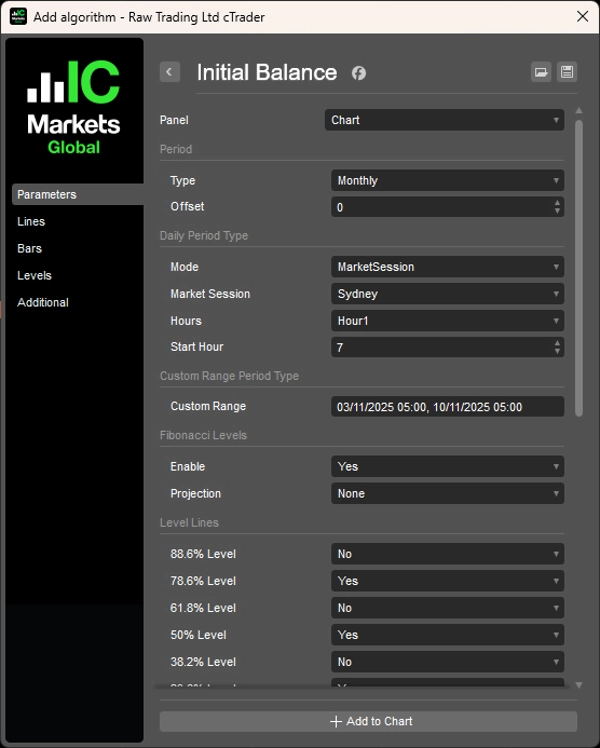
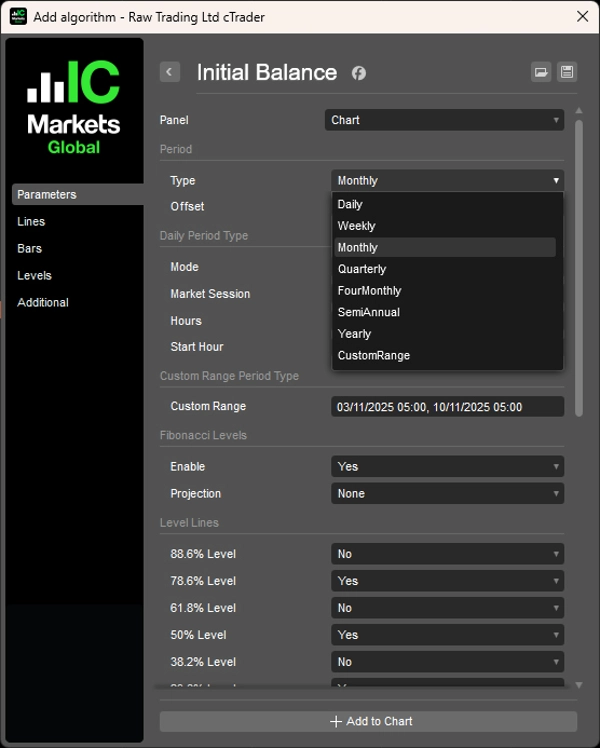
8つの期間タイプ
- 日次、週次、月次、四半期、4ヶ月、半年、年次、カスタムレンジ
- 日次モード:時間ベース(1〜12時間)またはマーケットセッション(シドニー/東京/ロンドン/NY)
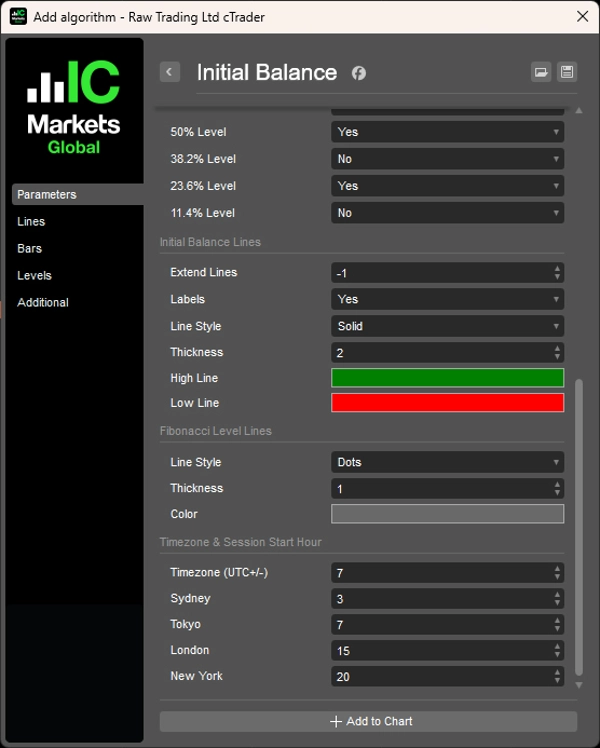
- タイムゾーン対応のUTCオフセット調整が可能なセッション開始時間の設定
- カスタムレンジ:イベントベースの分析のために正確な開始/終了日時を定義
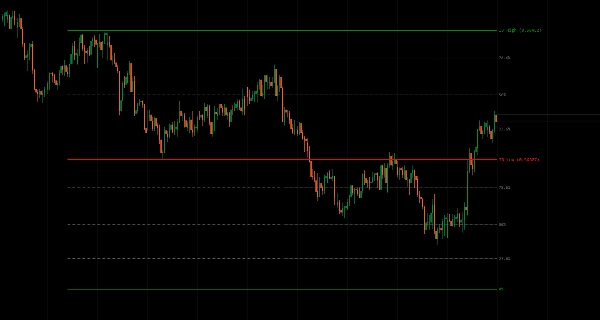
履歴期間
- 過去のIBレンジを表示するためのオフセットパラメータ(例:先週のIB、先月のIB)
- 現在の価格動向を前期間の構造と比較
- トレンド確認のためのマルチ期間分析
フィボナッチレベル
- IBレンジ内のオプション7レベル(11.4%、23.6%、38.2%、50%、61.8%、78.6%、88.6%)
- バランス内の平均回帰ゾーン
- 正確なエントリー/エグジットの参照ポイント
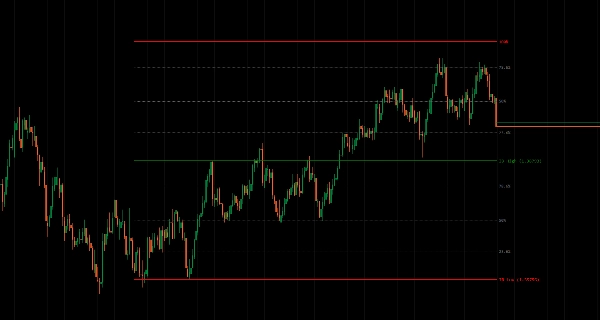
フィボナッチ予測
- IBの高値/安値からレベルを上向き/下向きに予測
- レンジを超えた潜在的なブレイクアウトターゲット
- 方向性の動きのための拡張ゾーン
ライン拡張制御
- IB期間のみ:形成期間中のレンジを表示
- 現在のバー:現在まで拡張
- N期間先:計画のために将来へ予測
- クリーンな視覚管理
精密な期間検出
- 各期間タイプの正確なオープニングレンジ計算
- グローバル市場向けのタイムゾーン対応
- セッションの重複と移行をクリーンに処理
__________________________________________________________________________________________
その他の無料インジケーター
構造やボリュームから回帰、ボラティリティ、カスタムタイムフレームまで、幅広い市場分析ツールを探求してください。
ソースコードはGitHub リポジトリで利用可能です。
すべて無料で使用できます。ただし、コーヒーサポートを送りたい場合は、こちらからどうぞ。
サポート/レジスタンス
ボリューム
移動平均
- SSLチャネル
- アンカード移動平均
- 偏差スケール移動平均
- ギャン高安アクティベーター
- 瞬時トレンドライン
- カウフマン適応MAとトレンドビジョン
- 移動平均チャネル
- 移動平均スイート
- トレンドチャネル移動平均
ユーティリティ/カスタム
回帰ベース
ボラティリティ
オシレーター
__________________________________________________________________________________________
免責事項
取引にはリスクが伴います。このインジケーターはテクニカル分析専用です—常に適切なリスク管理を適用し、責任を持って取引してください。
フィードバックと改善
ご提案、機能リクエスト、改善アイデアがある場合は、ディスカッションタブにコメントを残してください。皆様のフィードバックはインジケーターの改善に役立ちます。
概要
Key features include configurable session start times with UTC offset adjustments, historical offset parameters for comparing past initial balance ranges, and multi-period analysis for trend confirmation. It offers optional Fibonacci retracement levels (11.4% to 88.6%) within the initial balance range to highlight mean reversion zones and precise entry or exit points. Additionally, Fibonacci projections extend upward or downward from the initial balance boundaries to indicate potential breakout targets and directional extension zones.
Line extension controls allow users to display the range during its formation, extend it to the current bar, or project it forward for planning purposes. The indicator ensures precise period detection, handling session overlaps and transitions accurately for global market analysis. This tool aids traders in identifying breakout, mean reversion, and volatility expectations based on opening range structures across all timeframes.
カスタマーレビュー
5 | 50 % | |
4 | 50 % | |
3 | 0 % | |
2 | 0 % | |
1 | 0 % |