Beschreibung
🚀 Über 10.000 Trader nutzen bereits unsere TOP Indikatoren🏆
Entdecken Sie, warum Profis uns wählen – die leistungsstärksten Werkzeuge auf cTrader (Indikatoren, Algorithmen und cBots) warten auf Sie.
👉 Holen Sie sich hier alle unsere TOP-Systeme:
_______________________________________________
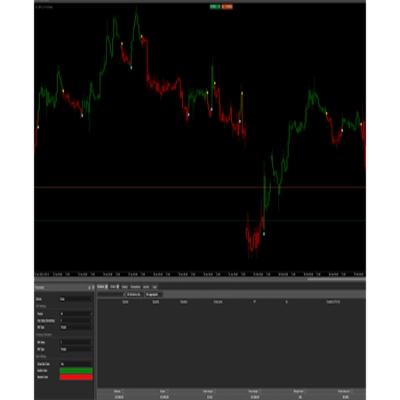
📌 Market Structure Indicators
· ✅ AdvancedMarket Structure: Bos, Choch, SwinLevels, Order Blocks, Market Structure& Liquidity Finder
· 🔄 Dynamic Market StructureAnalysis of Turning Points
· 🧱 Order Block
· ⚖️ Market Imbalance
· ⛓️ BOS & CHOCH
· 🧠 ICT Power of 3
_______________________________________________
🔚 Smart Exit Systems
_______________________________________________
📐 ZigZag Indicators
· 🔍 ZigZag Price LiquidityProjection
· ➖ ZigZag
_______________________________________________
🧱 Support & Resistance Indicators
· 🟩 SmartTrend Support &Resistance Lines
· 🧱 All Support and ResistanceLevels
_______________________________________________
📊 Trend & Channel Indicators
· 📊 Supertrend
_______________________________________________
💧 Volume & Liquidity Tools
_______________________________________________
⚡ Momentum & RSI Indicators
· 🔎 Multi-Level Candle Bias
Tracker
_______________________________________________
🔮 Prediction & Projection Tools
· 📐 Vorhersage basierend auf Linreg& ATR
· 📏 Fibonacci Lineare RegressionMulti-Zeitrahmen
· 📈 Volumenbetriebener Market Flow Projector
______________________________________________________________________________________________
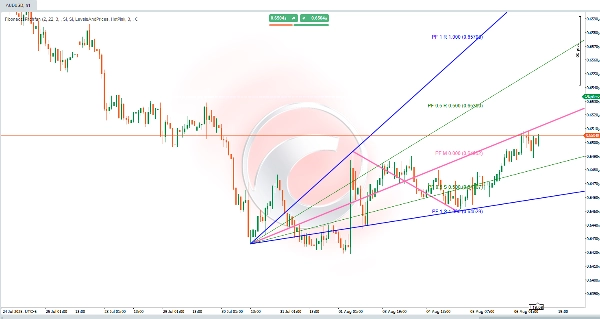
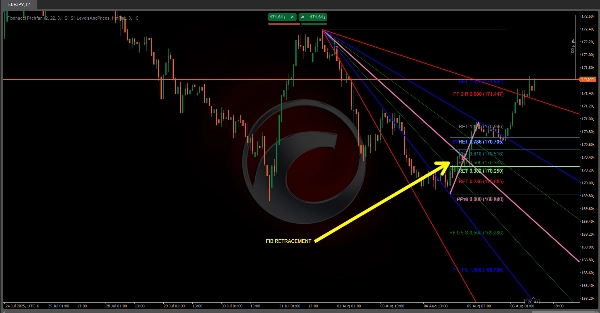
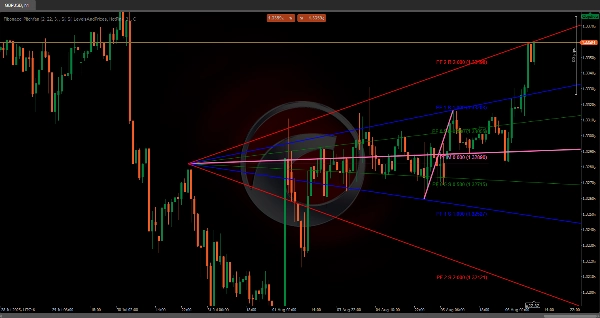
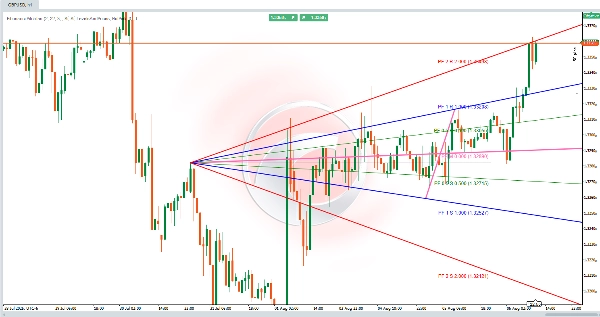
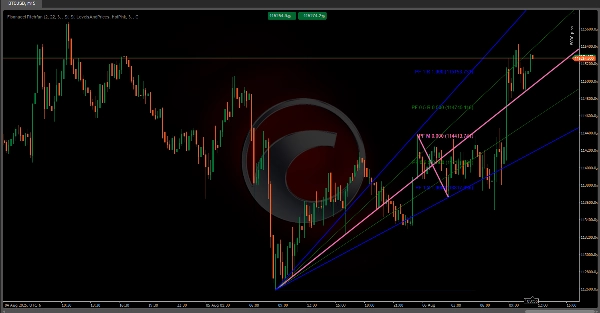
Fibonacci Pitchfan 📊✨
Ein fortgeschrittener technischer Indikator , der Pivot-Erkennung, dynamische Trendlinien und Fibonacci-Niveaus kombiniert, um ein visuelles Werkzeug zu schaffen, das Tradern hilft, Trends, Unterstützungs-/Widerstandszonen und potenzielle Umkehrpunkte zu identifizieren. 🎯 Hochgradig anpassbar passt es sich verschiedenen Handelsstilen über konfigurierbare Parameter an. Nachfolgend eine Aufschlüsselung seiner Logik und Berechnungen.
Kernkomponenten 🔧
Der Indikator basiert auf drei Schlüsselelementen, die zusammenarbeiten:
1. Pivot-Erkennung 🔄
- Identifiziert wichtige Preisumkehrpunkte (Hoch-/Tief-Pivots).
- Verwendet einen benutzerdefinierten Balkenbereich (Pivot-Tiefe), um zu bestimmen, ob ein Balken ein signifikantes Hoch/Tief im Vergleich zu den umliegenden Balken ist.
- Filtert Rauschen, indem Pivots eine auf ATR basierende Abweichungsschwelle überschreiten müssen, sodass nur relevante Preisschwankungen berücksichtigt werden.
2. TrendFan & Fibonacci-Niveaus 📐
- Projeziert einen Fächer dynamischer Trendlinien von einem historischen Pivot in die Zukunft, wobei vordefinierte Niveaus (z. B. 0,25, 0,5, 1,0) verwendet werden, um potenzielle Unterstützungs-/Widerstandszonen zu markieren.
- Optionale Fibonacci-Niveaus (horizontale Linien) heben Retracements/Extensions zwischen wichtigen Pivots hervor.
Berechnungslogik 🧮
1. Pivot-Identifikation
- Für jeden Balken durchsucht der Algorithmus einen symmetrischen Bereich von vorherigen/nachfolgenden Balken (basierend auf der Pivot-Tiefe).
- Ein Hoch-Pivot wird bestätigt, wenn das Hoch des Balkens das höchste im Bereich ist; ein Tief-Pivot , wenn sein Tief das niedrigste ist.
- Die Abweichungsschwelle (ein % des ATR relativ zum Preis) filtert kleinere Schwankungen heraus und konzentriert sich auf bedeutende Marktbewegungen.
2. TrendFan-Erzeugung 🌪️
- Ein referenzieller historischer Pivot (konfigurierbar) wird mit dem letzten Pivot verbunden, um eine Basislinie zu bilden.
- Eine Mittellinie wird zwischen ihnen gezogen, und projizierte Trendlinien (auf vordefinierten Niveaus) erstrecken sich in die Zukunft und erzeugen einen "Fächer" aus wichtigen Preiszonen.
3. Fibonacci-Projektionen 🔢
- Retracement-Niveaus (z. B. 0,236, 0,5, 0,618) markieren potenzielle Rückzugsbereiche innerhalb der vorherigen Preisbewegung.
- Extensions-Niveaus projizieren Preisziele über den ursprünglichen Bereich hinaus, angepasst an die Trendrichtung.
- Niveaus können basierend auf Benutzereinstellungen invertiert oder erweitert werden.
Anpassbare Einstellungen ⚙️
- Abweichungsschwelle: Passt die Empfindlichkeit gegenüber Preisbewegungen an (ATR-basiert).
- Pivot-Tiefe: Definiert den Balkenbereich für die Pivot-Erkennung (beeinflusst die Signalhäufigkeit).
- Historische Referenz: Legt fest, wie weit zurück der anfängliche Pivot für den TrendFan ausgewählt wird.
- Sichtbarkeit: Schaltet die Anzeige von TrendFan/Fibonacci ein und aus und wählt spezifische Niveaus zur Anzeige aus.
Fazit 🏆
Der Fibonacci Pitchfan ist ein leistungsstarkes All-in-One-Werkzeug für Trader, die eine klare, dynamische Sicht auf die Marktstruktur suchen. Durch die Kombination von Pivots, Trendlinien und Fibonacci-Niveaus bietet es umsetzbare Einblicke, um Preisbewegungen vorherzusehen und fundierte Entscheidungen zu treffen. 🚀
Zusammenfassung
It generates a "TrendFan" by projecting dynamic trendlines from a configurable historical pivot to the latest pivot, creating a fan of key price zones. Optional Fibonacci retracement and extension levels highlight potential pullback areas and price targets, which can be customized or inverted according to user preferences.
Key customizable settings include deviation threshold sensitivity, pivot depth (bar range for pivot detection), historical reference for the initial pivot selection, and visibility options for TrendFan and Fibonacci levels. This tool is suitable for traders seeking actionable insights to anticipate price movements and make informed decisions based on a comprehensive view of market dynamics.