

คำอธิบาย
ตัวชี้วัด Pinescriptlabs Store: Pinescriptlabs Store cBots : (cBot) Gold & BTC BreakoutSession Pivots(ใหม่)
โครงสร้างตลาดขั้นสูง: Bos, Choch, SwinLevels, Order Blocks, Market Structure & Liquidity Finder (ใหม่)
การคาดการณ์สภาพคล่องราคา ZigZag
อัลกอริทึมสมาร์ทติดตาม (ใหม่)
SmartTrend Support &
Resistance
Lines
การวิเคราะห์
โครงสร้างตลาด
แบบไดนามิก
ของ
จุดกลับตัว
Points
ฟีโบนักชี
การถดถอยเชิงเส้น
หลายกรอบเวลา
Multi-timeframe
ช่องว่างมูลค่ายุติธรรมโมเมนตัม
ตัวติดตาม
แนวโน้มแท่งเทียนหลายระดับ
Tracker
แนวรับและ
แนวต้านอัตโนมัติ
แนวโน้ม
Lines
ระดับ
แนวรับและ
แนวต้านทั้งหมด
Levels
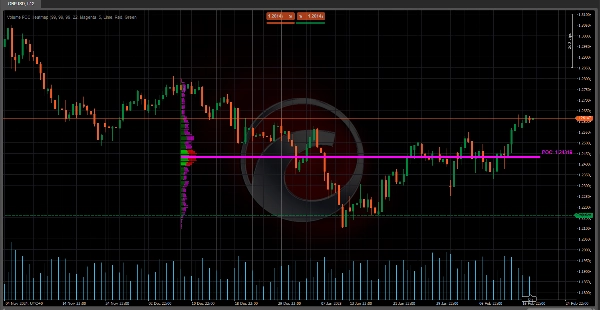
🔥 แผนที่ความร้อน Volume POC 🔥
ตัวชี้วัดนี้เป็น โปรไฟล์ปริมาณ ที่แสดงการกระจายของปริมาณการซื้อขายในระดับราคาต่าง ๆ ในช่วงเวลาที่กำหนด จุดประสงค์หลักคือการระบุ โซนแนวรับ/แนวต้านสำคัญ และพื้นที่ที่ตลาดแสดงความสนใจมากที่สุด (กิจกรรมการซื้อ/ขายสูง) มีประโยชน์มากสำหรับ:
- การตรวจจับจุดควบคุม (POC) 🎯
ระดับราคาที่มีปริมาณสูงสุด ทำหน้าที่เหมือนแม่เหล็กดึงดูดการเคลื่อนไหวของราคา - การแสดงภาพพื้นที่มูลค่า (VA)
โซนที่มีปริมาณรวมเฉพาะเปอร์เซ็นต์ (เช่น 70%) ซึ่งแสดงถึงความสมดุลระหว่างผู้ซื้อและผู้ขาย - การแยกแยะปริมาณกระทิงและหมี 📈📉
แสดงที่ที่พลังซื้อเทียบกับแรงกดดันขายสะสม
🧠 ตรรกะหลัก & การคำนวณ 🔢
- การแบ่งช่วงราคา 📏
-
- ช่วงราคา (จากต่ำสุดถึงสูงสุดใน B Bars ล่าสุด) ถูกแบ่งเป็น เซลล์ปริมาณ (CNum) .
ตัวอย่าง: ถ้า CNum = 33 ช่วงราคาจะถูกแบ่งเป็น 33 ระดับที่เท่ากัน
- ช่วงราคา (จากต่ำสุดถึงสูงสุดใน B Bars ล่าสุด) ถูกแบ่งเป็น เซลล์ปริมาณ (CNum) .
- การแจกแจงปริมาณตามระดับราคา 📊
-
- สำหรับแต่ละแท่งในข้อมูลประวัติศาสตร์:
-
- คำนวณปริมาณที่เกี่ยวข้องกับตัวแท่ง (ความแตกต่างระหว่างเปิดและปิด) และไส้เทียน (สูงสุดและต่ำสุด)
- ปริมาณจะถูกแจกแจงตามสัดส่วนในเซลล์ราคาที่แท่งนั้นตัดผ่าน
ตัวอย่าง: ถ้าแท่งสีเขียว (กระทิง) ครอบคลุม 3 เซลล์ ปริมาณจะถูกกำหนดให้กับเซลล์เหล่านั้นเป็น "ปริมาณกระทิง"
- การคำนวณจุดควบคุม (POC) 🎯
-
- POC คือเซลล์ที่มีปริมาณสะสมสูงสุด แสดงถึงราคาที่มีความเห็นพ้องมากที่สุดระหว่างผู้ซื้อและผู้ขาย
- การคำนวณพื้นที่มูลค่า (VA) 🔄
-
- ขยายจาก POC ขึ้น/ลงจนครอบคลุมเปอร์เซ็นต์ที่กำหนดของปริมาณรวม (เช่น 70%)
ตัวอย่าง: ถ้า VA อยู่ระหว่าง 100 ถึง 105 หมายความว่ามีการซื้อขาย 70% ของปริมาณภายในช่วงนั้น
- ขยายจาก POC ขึ้น/ลงจนครอบคลุมเปอร์เซ็นต์ที่กำหนดของปริมาณรวม (เช่น 70%)
- การปรับภาพให้เป็นมาตรฐาน 🖼️
-
- ปริมาณจะถูกปรับขนาดโดยใช้ ปัจจัยสเกล เพื่อปรับความกว้างของแท่งในแผนภูมิ ทำให้ง่ายต่อการดู
🛠️ กุญแจของแผนที่ความร้อน Volume POC 💡
- ขาดบริบทในตัวชี้วัดปริมาณแบบดั้งเดิม 🤔
ตัวชี้วัดปริมาณคลาสสิก (เช่น ปริมาณแท่งต่อแท่ง) ไม่แสดงว่าปริมาณถูกซื้อขายที่ไหน ตัวชี้วัดนี้แสดงแผนที่ปริมาณตามระดับราคา แก้ปัญหานี้ - การระบุแนวรับ/แนวต้านแบบออร์แกนิก 🚀
โซนที่มีปริมาณสูงทำหน้าที่เป็นแนวรับ/แนวต้านแบบไดนามิก ซึ่งน่าเชื่อถือกว่าการใช้เส้นคงที่ - การตรวจจับความไม่สมดุล ⚖️
พื้นที่ที่มีปริมาณกระทิงหรือหมีเด่นชัดบ่งชี้ถึงการเบรกเอาต์หรือการกลับตัวที่เป็นไปได้
💡 การใช้งานจริงในการเทรด 📈
- POC เป็นโซนที่น่าสนใจ 🎯
-
- ถ้าราคามาใกล้ POC คาดว่าจะมีปฏิกิริยาเช่นการดีดตัวหรือการรวมตัว
- พื้นที่มูลค่า (VA) เป็นโซนสมดุล 🔄
-
- ถ้าราคาอยู่นอก VA มักจะกลับเข้ามา (ผลแม่เหล็ก)
- ถ้าราคาอยู่ใน VA อาจบ่งชี้ถึงการรวมตัว
- ปริมาณกระทิง/หมีเป็นการยืนยัน 🔍
-
- การเพิ่มขึ้นของปริมาณกระทิงที่แนวต้านบ่งชี้การเบรกเอาต์ที่เป็นไปได้
- ปริมาณหมีสูงที่แนวรับบ่งชี้การเบรกดาวน์ที่เป็นไปได้
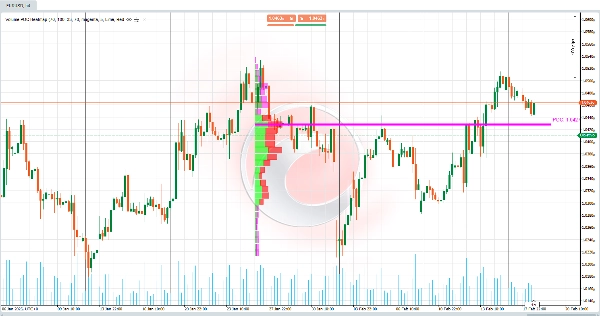
🌟 ตัวอย่าง 📊
พารามิเตอร์ที่ใช้ (มองเห็นและปรับแต่งได้โดยผู้ใช้):
- Bars Back = 55 → จำนวนแท่งประวัติศาสตร์ที่วิเคราะห์
- Volume Cells = 33 → จำนวนการแบ่ง/เซลล์ในช่วงราคา
- Value Area Volume % = 70 → เปอร์เซ็นต์ของปริมาณที่กำหนดพื้นที่มูลค่า
สถานการณ์:
- ราคาทะลุผ่านระดับแนวรับทางเทคนิค แต่ปริมาณในโซนนั้นต่ำ (ตามโปรไฟล์)
- ต่อมา ราคากลับเข้าสู่ พื้นที่มูลค่า (VA) ที่กำหนดโดย 70% ของปริมาณรวม
การตีความ:
- การเบรกเอาต์เป็นเท็จ (เนื่องจากปริมาณต่ำในโซนเบรกเอาต์)
- ตลาดพยายามปรับสมดุลภายใน พื้นที่มูลค่า ซึ่งมีกิจกรรมสูง (ความหนาแน่นของปริมาณสูง)
การดำเนินการ:
- มองหาโอกาสซื้อใกล้ขอบล่างของ VA หรือ POC เพราะเป็นโซนที่ผู้เข้าร่วมตลาดให้ความสนใจสูง
สรุป
Key functionalities include:
- Division of the price range into multiple volume cells for detailed volume mapping.
- Calculation of POC as the volume consensus price.
- Determination of the Value Area around the POC.
- Visual normalization of volume bars for clearer chart representation.
This tool addresses the limitation of traditional volume indicators by showing where volume was traded rather than just total volume per bar. It helps identify dynamic support and resistance zones based on volume concentration and detects volume imbalances that may signal potential breakouts or reversals. Traders can use it to anticipate price reactions near the POC and VA, aiding in decision-making for entries and exits. Configurable parameters include the number of historical bars analyzed, volume cells, and the percentage defining the Value Area.
รีวิวจากลูกค้า
5 | 100 % | |
4 | 0 % | |
3 | 0 % | |
2 | 0 % | |
1 | 0 % |


!["[Stellar Strategies] Market Session Ultimate" โลโก้](https://cdn.ctrader.com/image/webp/61ffd537-0125-4246-9e72-42eca1791d64_28232)

