
Round Numbers
อินดิเคเตอร์
395 ดาวน์โหลด
เวอร์ชัน 1.1, Dec 2025
Windows, Mac
4.0
รีวิว: 3
คำอธิบาย
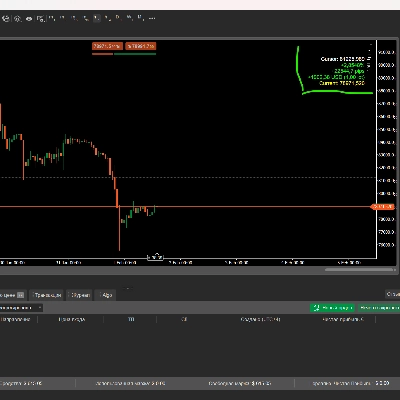
ตัวบ่งชี้แนวรับและแนวต้านของเลขกลม
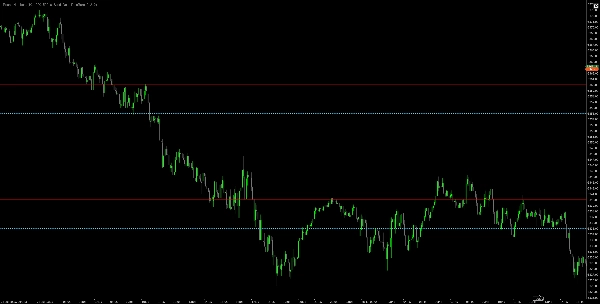
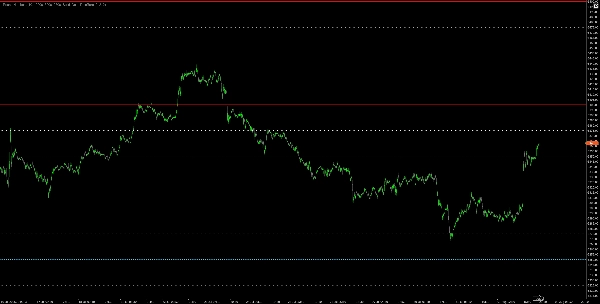
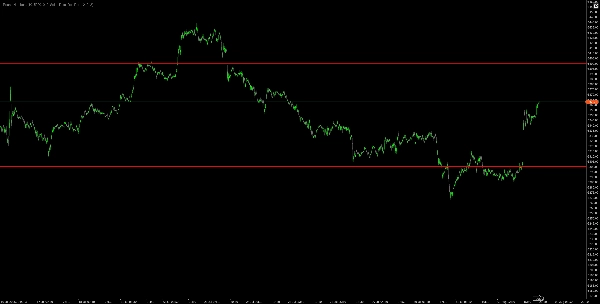
ตัวบ่งชี้ที่ทรงพลังนี้จะวาดเส้นแนวนอนของแนวรับและแนวต้านโดยอัตโนมัติที่ระดับเลขกลมที่มีความสำคัญทางจิตวิทยาบนกราฟของคุณ ตามที่เทรดเดอร์ที่มีประสบการณ์ทราบ ราคามักจะตอบสนองอย่างรุนแรงที่เลขกลมเช่น 1.2000, 1.2100, 1.2050 เพราะระดับเหล่านี้เป็นอุปสรรคทางจิตวิทยาที่เทรดเดอร์วางคำสั่งซื้อขายไว้
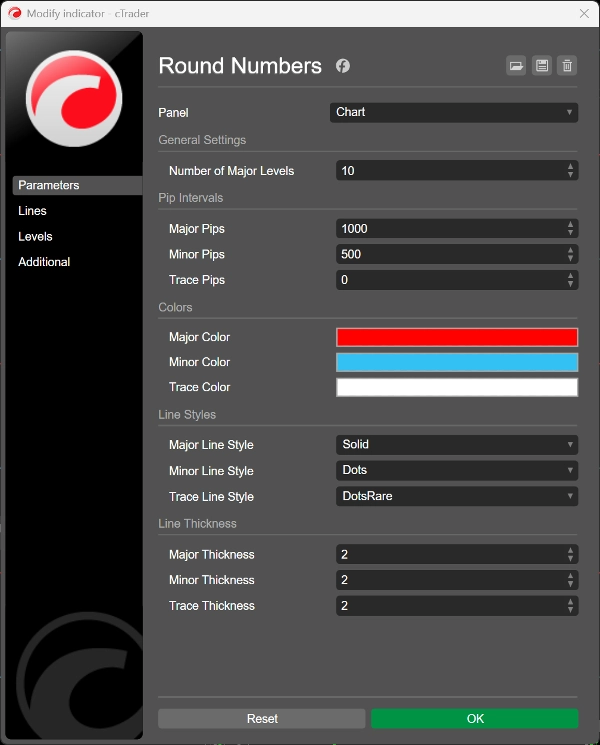
สิ่งที่มันทำในคำง่าย ๆ: 📊 วาดเส้นสามประเภทตามช่วงพิปที่คุณเลือก:
- ระดับหลัก (เส้นสีแดง ทึบ) - ระดับทางจิตวิทยาที่แข็งแกร่งที่สุด (โดยปกติทุก 100 พิป)
- ระดับรอง (เส้นประสีน้ำเงิน) - ระดับรอง (โดยปกติทุก 50 พิป)
- ระดับเส้นประ (จุดสีขาว ห่างกัน) - ระดับละเอียด (โดยปกติทุก 25 พิป)
คุณสมบัติหลัก:
✅ ปรับช่วงพิปสำหรับแต่ละประเภทระดับได้อย่างเต็มที่
✅ เลือกสีและรูปแบบเส้นของคุณเองเพื่อความชัดเจนบนกราฟ
✅ อัปเดตโดยอัตโนมัติเมื่อราคาขยับเพื่อแสดงระดับที่เกี่ยวข้องเสมอ
✅ รูปลักษณ์สะอาดและเป็นมืออาชีพที่ไม่ทำให้กราฟรก
✅ ใช้งานได้กับทุกช่วงเวลาและคู่สกุลเงิน
✅ ตั้งค่าเป็น 0 เพื่อซ่อนระดับที่ไม่ต้องการ
สรุป
สรุปโดย AI
The Round Numbers indicator automatically plots horizontal support and resistance lines at psychologically significant round number price levels on trading charts. It identifies three types of levels based on customizable pip intervals: major levels (solid red lines, typically every 100 pips), minor levels (dotted blue lines, typically every 50 pips), and trace levels (sparse white dots, typically every 25 pips). These levels represent price points where traders often place orders, influencing market behavior.
Key features include full customization of pip intervals, colors, and line styles for each level type, ensuring clear chart visibility. The indicator updates dynamically as prices move to maintain relevant support and resistance lines. It is designed to provide a clean, professional appearance without cluttering charts and is compatible with all timeframes and currency pairs. Users can disable any level type by setting its interval to zero.
This tool supports multiple markets including Forex, indices, commodities, cryptocurrencies, and stocks, making it versatile for various trading strategies that rely on psychological price barriers.
โปรไฟล์อินดิเคเตอร์
รีวิวจากลูกค้า
การสนทนา
คำถามที่พบบ่อย
Prop
Forex
Indices
Commodities
Crypto
Grid
Stocks
ผลิตภัณฑ์ที่มีให้บริการผ่าน cTrader Store รวมถึงบอทการเทรด อินดิเคเตอร์ และปลั๊กอิน มีให้บริการโดยนักพัฒนาบุคคลที่สามและมีไว้เพื่อวัตถุประสงค์ในการเข้าถึงข้อมูลและทางเทคนิคเท่านั้น cTrader Store ไม่ใช่โบรกเกอร์และไม่ได้ให้คำแนะนำการลงทุน คำแนะนำส่วนบุคคล หรือการรับประกันผลการดำเนินงานในอนาคต
เพิ่มเติมจากผู้เขียนคนนี้


ราคา
239.94M
ปริมาณการเทรด
1.84M
Pips ที่ได้กำไร
2
การขาย
4.84K
ติดตั้งฟรี