
Description
LogicLadder Smart SR Zones | Support et Résistance Professionnels
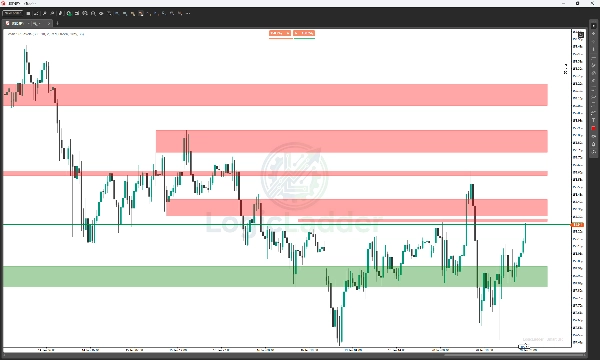
Arrêtez de deviner où le marché va tourner. LogicLadder Smart SR visualise les zones institutionnelles où le prix est susceptible de réagir. Conçu pour les traders Price Action, cet indicateur met instantanément en évidence le "plancher" et le "plafond" du marché, vous permettant de vous concentrer sur l'exécution plutôt que sur l'analyse.
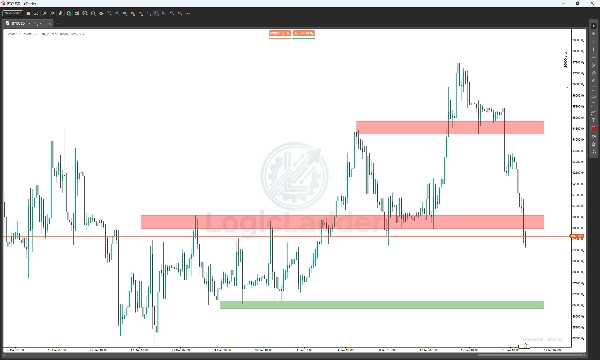
Parfait pour les stratégies Break & Retest : Regardez une zone de Support Verte devenir Rouge immédiatement après une cassure, vous donnant une confirmation visuelle claire pour rechercher des configurations de vente.
Pourquoi utiliser Smart SR ?
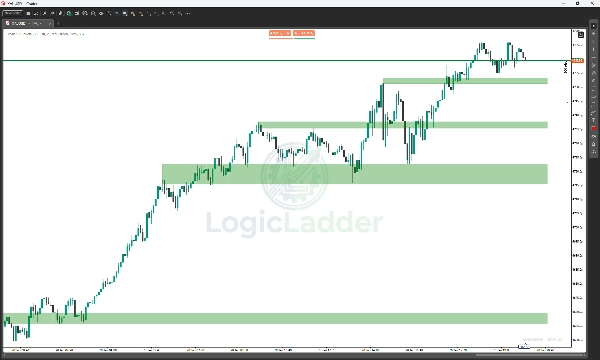
- Clarté Visuelle : Voyez instantanément où les acheteurs et les vendeurs attendent.
- Réduction du Bruit : Le filtre "Pivot Strength" ignore le bruit mineur du marché, ne montrant que les niveaux importants.
- Pas de Repeinture : Ce que vous voyez sur le graphique est exactement ce qui s'est passé.
- Entièrement Personnalisable : Ajustez les couleurs, la transparence et les périodes de rétroaction pour correspondre à votre style de trading personnel.
Conseil de Trading : Attendez que le prix approche une zone "Fraîche" (gris). Si le prix rebondit, entrez dans le sens de la tendance. Si le prix casse, attendez le changement de couleur (Rouge/Vert) et tradez le retest.
Option 3 : Court & Percutant (Idéal pour les réseaux sociaux / Discord)
Utilisez ceci pour des partages rapides.
Titre : LogicLadder Smart SR Zones
Description : Automatisez votre analyse technique avec Smart SR Zones. Cet indicateur cTrader détecte les points Pivot clés et trace des zones précises de Support & Résistance qui se mettent à jour en temps réel.
✅ Changement Automatique de Couleur : Les zones passent du Rouge au Vert lors des cassures.
✅ Sans Latence : Les anciennes zones sont automatiquement supprimées pour garder les graphiques rapides.
✅ Pas de Repeinture : Ancrages fixes basés sur le temps.
✅ Interface Propre : Transparence et style professionnels.
Résumé
Key features include:
- Visual clarity with clear identification of buyer and seller zones.
- A "Pivot Strength" filter that reduces market noise by showing only significant levels.
- No repainting, ensuring that displayed zones reflect actual historical price action.
- Full customization options for colors, transparency, and look-back periods.
- Automatic deletion of outdated zones to maintain chart performance.
- Support for break and retest trading strategies by signaling zone flips after breakouts.
The indicator supports multiple markets including Forex, indices, commodities, stocks, and cryptocurrencies, with tags referencing popular symbols like BTCUSD, EURUSD, GBPUSD, XAUUSD, NAS100, and USDJPY. It provides a clean, professional user interface optimized for efficient technical analysis.


![Logo de "[Stellar Strategies] QQE"](https://cdn.ctrader.com/image/webp/e702104a-874c-4b39-97dd-fb34518d1015_27712)


