
Smart Trend Scanner
インジケーター
311 ダウンロード数
バージョン 1.0、Jan 2026
Windows、Mac
説明
SmartTrendScanner
概要
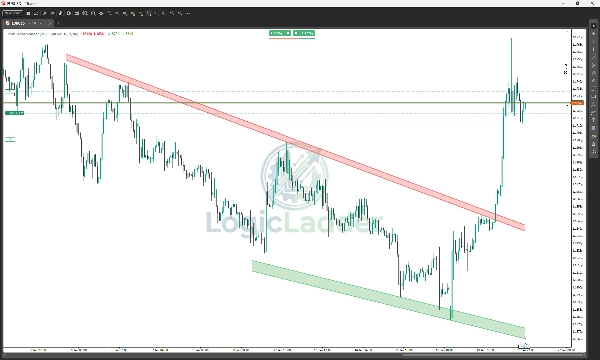
SmartTrendScanner は、トレンド分析の主観的な技術を自動化するために設計されたプロフェッショナルグレードのcTraderインジケーターです。従来の細い単一価格のトレンドラインを描くインジケーターとは異なり、SmartTrendScannerは動的な 供給&需要クラウドゾーン を特定し、視覚化します。
「ベストフィット」アルゴリズムによって駆動され、過去の価格動向をスキャンして最も数学的に重要な接続点を見つけ、サポートとレジスタンスの 真の 領域を表す塗りつぶされたチャネルを描画します。
主な特徴
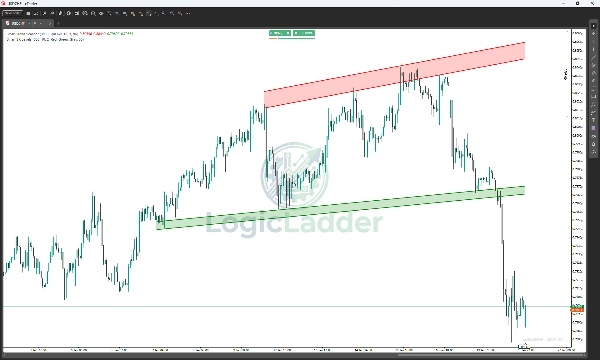
- 動的クラウドゾーン: 細い線を塗りつぶされた「クラウド」チャネルに置き換え、価格のタッチ範囲(ヒゲと実体全体)を視覚的にカバーし、フェイクアウトを防ぎます。
- インテリジェントピボット検出: カスタム感度設定に基づいて、主要なスイング高値とスイング安値を自動的に識別します。
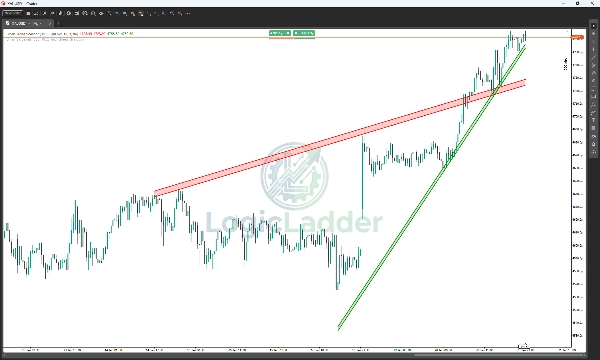
- ベストフィットアルゴリズム: インジケーターはバックグラウンドで数千の潜在的なトレンドラインを作成し、現在の価格に最も近い最強で最も尊重されるゾーンのみを表示するようにフィルタリングします。
- 安定性フィルター: 壊れた構造をチェックする組み込みロジックにより、無効または古くなったレベルでの取引を防ぎます。
- リアルタイムアラート: 動きを見逃しません。価格がゾーンを突破したりレベルを再テストしたときに即座にポップアップとサウンド通知を受け取ります。
- 完全カスタマイズ可能: クラウドの透明度、色、ピボット強度、履歴の遡りを調整して、スキャルピング、デイトレード、スイングなどの取引スタイルに合わせられます。
仕組み
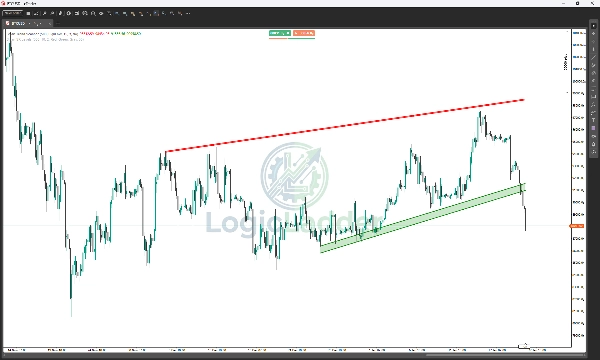
- 履歴のスキャン: インジケーターはユーザー定義のバー数(例:300バー)を遡ってフラクタルピボットポイントを探します。
- 点の接続: ピボット間の接続をテストして有効なトレンド傾斜を見つけます。
- ゾーンの検証: 価格が最近の過去に十分な回数(最小タッチ数)「接触」し、大きく破られていないかをチェックします。
- クラウドの描画: 有効なトレンドが見つかると、最高のヒゲタッチと最低の実体タッチの間に透明なクラウドを描き、「アクションゾーン」を作成します。
設定ガイド
- 適用バー数: スキャナーが遡って見る履歴の長さ(デフォルト:300)。長期スイングトレードにはこれを増やします。
- ピボット強度: フラクタル検出の感度。数値が高い(例:15以上)と主要な構造ポイントを見つけ、低い(例:5)と内部の小さな構造を見つけます。
- 最小ピボット確認: ゾーンが有効と見なされるために価格が接触しなければならない最小回数。
- ゾーン透明度: 塗りつぶし色の不透明度を制御(0 = 透明、255 = 不透明)。
なぜLogicLadderなのか?
トレーディングは確実性ではなく確率の問題です。サポートとレジスタンスを ゾーン として視覚化することで、 SmartTrendScanner は 本当の 流動性がどこに隠れているかを見せ、群衆より一歩先を行く手助けをします。
概要
AIによる概要
Smart Trend Scanner is a professional-grade indicator for the cTrader platform that automates trend analysis by identifying and visualizing dynamic supply and demand zones as filled cloud channels rather than traditional thin trendlines. Using a "Best-Fit" algorithm, it scans historical price data to detect key swing highs and lows, connecting these pivot points to form mathematically significant support and resistance zones. The indicator validates zones by confirming multiple price touches without significant recent breaks, then draws transparent clouds between the highest wick and lowest body touches to represent true areas of market interest.
Key features include dynamic cloud zones that cover the full price range to reduce false signals, intelligent pivot detection adjustable by sensitivity, stability filters to avoid outdated levels, and real-time alerts for breakouts or retests. Users can customize settings such as lookback period, pivot strength, minimum touches for zone validation, and cloud transparency to suit various trading styles including scalping, day trading, and swing trading.
Smart Trend Scanner supports multiple markets including Forex, commodities, stocks, and cryptocurrencies, with symbol tags like BTCUSD, EURUSD, GBPUSD, XAUUSD, and NAS100. It aims to provide clearer visualization of liquidity zones to assist traders in making informed decisions based on probabilistic support and resistance areas.
インジケーターのプロフィール
カスタマーレビュー
0.0
レビュー: 0
カスタマーレビュー
この商品にはまだレビューがありません。お使いになったことがある方は、ぜひレビューをお願いします。
ディスカッション
よくあるご質問
BTCUSD
Forex
EURUSD
Commodities
GBPUSD
NZDUSD
Prop
Scalping
Crypto
Stocks
XAUUSD
NAS100
USDJPY
cTrader Storeで入手可能な取引ボット、インジケーター、プラグインなどの商品は、第三者の開発者が提供するものであり、情報と技術の取得のみを目的としてご利用いただけます。cTrader Storeはブローカーではなく、投資助言や個人的な推奨を行うことも、将来のパフォーマンスを保証することもありません。
この作成者の他の商品


これも好きかも


価格
登録日 09/01/2026
704
無料インストール