
Market Entropy
อินดิเคเตอร์
107 ดาวน์โหลด
เวอร์ชัน 1.0, Aug 2025
Windows, Mac
คำอธิบาย
Market Entropy เป็นตัวชี้วัดคู่ (oscillator + ตัวเลือกการซ้อนราคาที่เป็นทางเลือก) ที่วัดการจัดระเบียบของตลาดและแจ้งเตือนการเปลี่ยนแปลงระบอบผ่าน Order → Transition → Chaos. มันเพิ่มเส้นที่สอง, Trendness (DC) เพื่อแยก แนวโน้มที่แท้จริง ออกจาก การบีบความผันผวน.
วิธีการทำงาน:
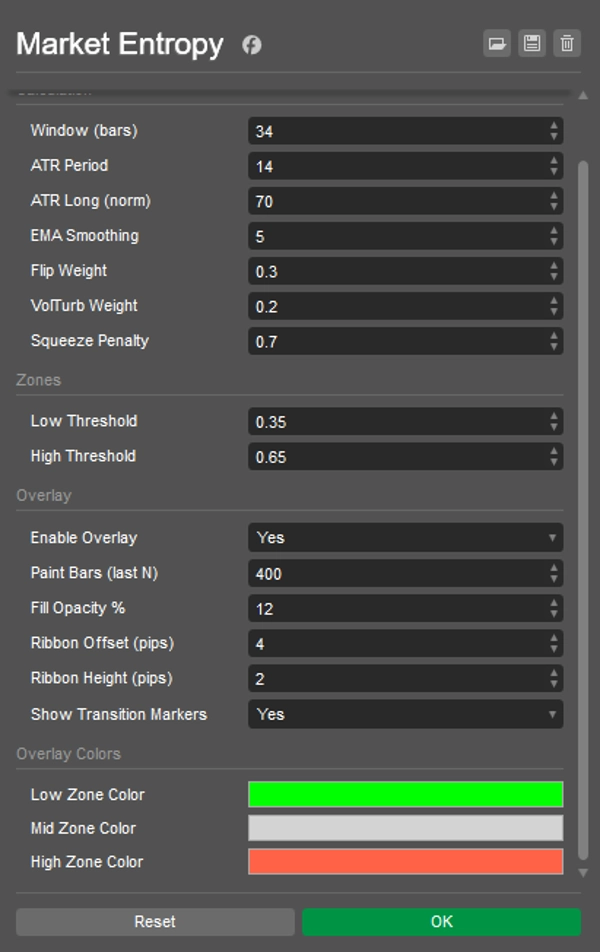
- ใช้เฉพาะส่วนประกอบ OHLCV: DC (ความสม่ำเสมอของทิศทาง), FlipRate (การเปลี่ยนแปลงสัญลักษณ์), Volatility_n (ATR/ATRlong), VolumeTurb (ค่าเบี่ยงเบนมาตรฐานของ ΔVolume).
- เอนโทรปีดิบ:
E0 = 0.5*(1-DC) + 0.3*(FlipRate*VolN) + 0.2*VolumeTurb). - เทอมต้านการบีบลดค่า E ในช่วง การบีบอัด ATR → ค่า Entropy ∈ [0..1] สุดท้ายพร้อมการปรับค่า EMA.
- เครื่องหมาย:
-
- CRYSTAL — ข้าม ต่ำกว่า LowThr (การจัดระเบียบเกิดขึ้น: แนวโน้มหรือการบีบก่อนแตกหัก).
- DISSOLVE — ข้าม สูงกว่า HighThr (การจัดระเบียบแตก: ความสับสน/แนวโน้มเสื่อม).
สิ่งที่คุณเห็น:
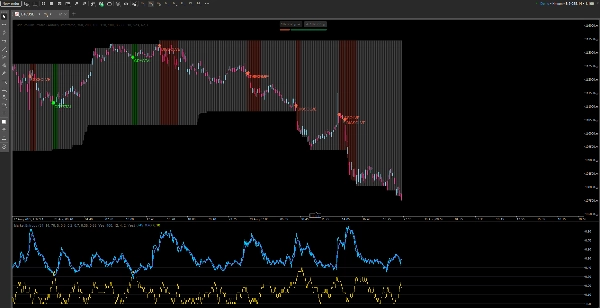
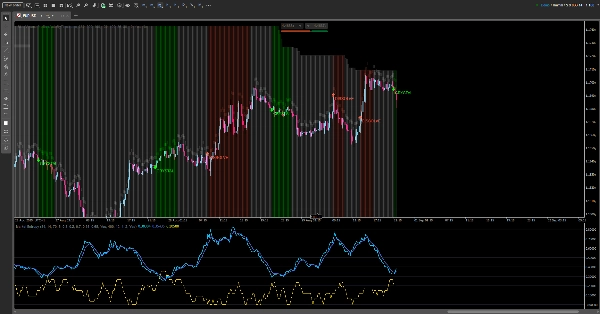
- ในแผง: Entropy, Entropy(EMA), Trendness (DC), เกณฑ์ต่ำ/สูง, พื้นหลังโซน.
- บนแผนภูมิ (เปิด/ปิดได้): แถบสีสถานะ, ริบบิ้น บางเหนือจุดสูงสุด, และเครื่องหมาย CRYSTAL/DISSOLVE.
คู่มือการอ่าน:
- E < LowThr → การจัดระเบียบ:
-
- ด้วย DC สูง → แนวโน้ม ที่จัดระเบียบ;
- ด้วย ATR ต่ำ → การบีบ (คาดว่าจะเกิดการแตกหัก).
- LowThr…HighThr → การเปลี่ยนผ่าน: โครงสร้างกำลังสร้าง; รอการแก้ไข.
- E > HighThr → ความสับสน: ความไม่แน่นอน / แนวโน้มเสื่อม; หลีกเลี่ยงการเข้าต่อเนื่องแบบง่ายๆ.
คู่มือการเล่น:
- การบีบ → CRYSTAL → แตก/ทดสอบซ้ำ — เทรดการแตกหัก.
- แนวโน้ม → DISSOLVE — ลดขนาดหรือเพิ่มความเข้มงวดของความเสี่ยง.
สรุป
โปรไฟล์อินดิเคเตอร์
รีวิวจากลูกค้า
0.0
รีวิว: 0
รีวิวจากลูกค้า
ยังไม่มีรีวิวสำหรับผลิตภัณฑ์นี้ หากเคยลองแล้ว ขอเชิญมาเป็นคนแรกที่บอกคนอื่น!
การสนทนา
คำถามที่พบบ่อย
ผลิตภัณฑ์ที่มีให้บริการผ่าน cTrader Store รวมถึงบอทการเทรด อินดิเคเตอร์ และปลั๊กอิน มีให้บริการโดยนักพัฒนาบุคคลที่สามและมีไว้เพื่อวัตถุประสงค์ในการเข้าถึงข้อมูลและทางเทคนิคเท่านั้น cTrader Store ไม่ใช่โบรกเกอร์และไม่ได้ให้คำแนะนำการลงทุน คำแนะนำส่วนบุคคล หรือการรับประกันผลการดำเนินงานในอนาคต


ราคา
ตั้งแต่ 26/05/2025
388.58M
ปริมาณการเทรด
60.75K
Pips ที่ได้กำไร
15
การขาย
1.41K
ติดตั้งฟรี