คำอธิบาย
เส้นสูง & ต่ำ ADR
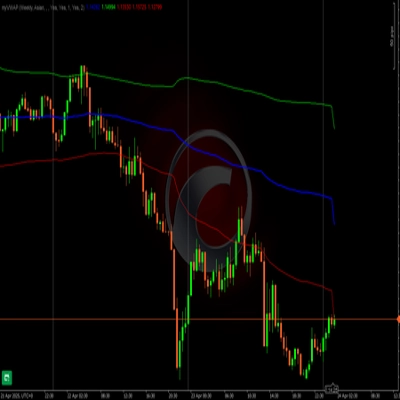
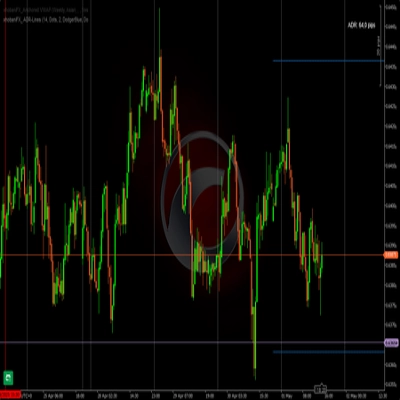
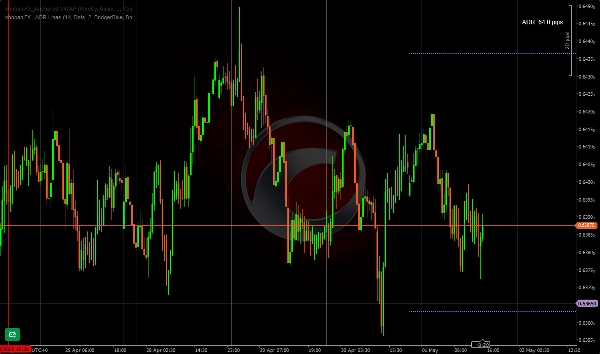
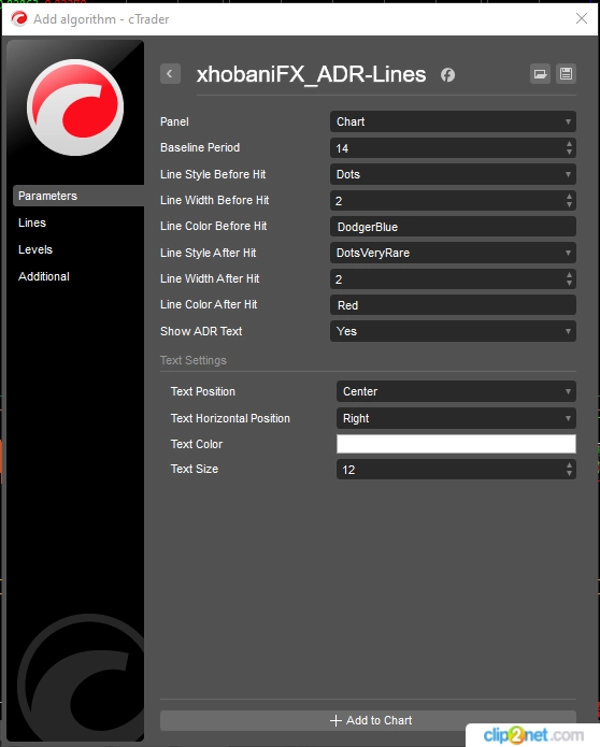
ตัวบ่งชี้ ADR นี้จะแสดงเส้นแนวนอนสำหรับราคาต่ำ/สูงของวันปัจจุบันตามช่วงเวลาที่เทรดเดอร์ต้องการ ฉันชอบและใช้ 14 วันเป็นช่วงเวลาพื้นฐาน เหมาะอย่างยิ่งสำหรับนักเก็งกำไรระยะสั้น/เทรดภายในวัน ดังนั้นคุณจะสังเกตได้ง่ายเมื่อราคาสูง/ต่ำถูกทำถึง คุณสามารถเลือกสี/สไตล์/ความกว้างของเส้นเพื่อเปลี่ยนเป็นสีที่คุณเลือกเมื่อถึงจุดนั้น
ตัวบ่งชี้นี้ถูกพัฒนาในลักษณะที่คุณสามารถปรับแต่งพารามิเตอร์ส่วนใหญ่ให้เหมาะกับความชอบของคุณและสอดคล้องกับพื้นที่ทำงานและสีของคุณ
ขอให้เทรดอย่างมีความสุข!
xhobani_FX
สรุป
สรุปโดย AI
xhobaniFX_ADR-Lines is an Average Daily Range (ADR) indicator designed for scalpers and intraday traders. It plots horizontal lines representing the current day's high and low levels based on a user-defined period, with 14 days commonly used as a baseline. The indicator visually highlights when these high or low levels are reached by allowing customization of line color, style, and width to change upon being hit. Most parameters are adjustable to fit individual trading preferences and workspace aesthetics. This tool aids traders in quickly identifying key price levels within the trading day.
โปรไฟล์อินดิเคเตอร์
รีวิวจากลูกค้า
4.0
รีวิว: 2
5 | 0 % | |
4 | 100 % | |
3 | 0 % | |
2 | 0 % | |
1 | 0 % |
การสนทนา
คำถามที่พบบ่อย
ผลิตภัณฑ์ที่มีให้บริการผ่าน cTrader Store รวมถึงบอทการเทรด อินดิเคเตอร์ และปลั๊กอิน มีให้บริการโดยนักพัฒนาบุคคลที่สามและมีไว้เพื่อวัตถุประสงค์ในการเข้าถึงข้อมูลและทางเทคนิคเท่านั้น cTrader Store ไม่ใช่โบรกเกอร์และไม่ได้ให้คำแนะนำการลงทุน คำแนะนำส่วนบุคคล หรือการรับประกันผลการดำเนินงานในอนาคต