
Açıklama
🚀 10.000+ tüccar zaten en iyi göstergelerimizi🏆 kullanıyor
Profesyonellerin neden bizi seçtiğini keşfedin – en güçlü araçlar cTrader'da (göstergeler, algoritmalar ve cBotlar) sizi bekliyor.
👉 Tüm en iyi sistemlerimizi buradan edinin:
_______________________________________________
📌 Piyasa Yapısı Göstergeleri
· ✅ AdvancedMarket Structure: Bos, Choch, SwinLevels, Order Blocks, Market Structure& Likidite Bulucu
· 🔄 Dinamik Piyasa Yapısı Dönüş Noktalarının Analizi
· 🧱 Order Block
· ⚖️ Piyasa Dengesizliği
· ⛓️ BOS & CHOCH
· 🧠 ICT Güç 3
_______________________________________________
🔚 Akıllı Çıkış Sistemleri
· 📍 Takip Eden Akıllı Algoritma
_______________________________________________
📐 ZigZag Göstergeleri
· 🔍 ZigZag Fiyat Likidite Projeksiyonu
· ➖ ZigZag
· 🎯 Zig-Zag Uç Nokta Takipçisi
_______________________________________________
🧱 Destek & Direnç Göstergeleri
· 🟩 SmartTrend Destek & Direnç Çizgileri
· 🧱 Tüm Destek ve Direnç Seviyeleri
_______________________________________________
📊 Trend & Kanal Göstergeleri
· 📊 Süpertrend
· 🧠 Uyarlanabilir Trend Kanalı
· 🔁 Reaktif Hareketli Ortalama
_______________________________________________
💧 Hacim & Likidite Araçları
· 🔍 Momentum Adil Değer Boşluğu
· 🕒 Adil Değer Boşluğu Seansları
_______________________________________________
⚡ Momentum & RSI Göstergeleri
· 🔎 Çok Katmanlı Mum Eğilimi
Takipçisi
_______________________________________________
🔮 Tahmin & Projeksiyon Araçları
· 📐 Linreg& ATR'ye Dayalı Tahmin
· 📏 Fibonacci Doğrusal Regresyon Çoklu Zaman Çerçevesi
· 📈 Hacim Destekli Piyasa Akışı Projeksiyonu
🟢 Emir Bloklarını Tanımlama 🔴
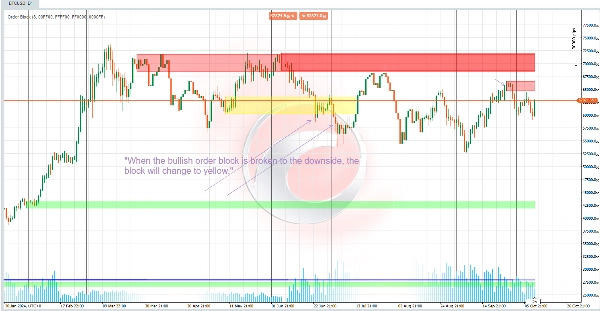
**Boğa Emir Bloğu 🚀:**
Bir boğa emir bloğunu tespit etmek için:
- Kod, mevcut kapanış fiyatının önceki bir salınımın en yüksek noktasını aşıp aşmadığını kontrol eder ⬆️.
- Eğer aşarsa ve o salınım henüz geçilmemişse, geçilmiş olarak işaretlenir. Emir bloğu, önceki mumlardaki en düşükten en yükseğe kadar olan fiyat aralığı olarak tanımlanır 📈.
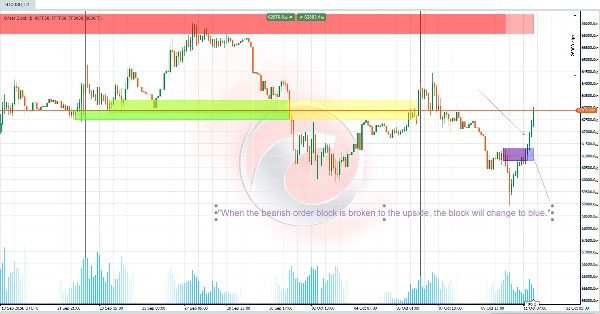
**Ayı Emir Bloğu 🔻:**
- Bu benzer şekilde çalışır ancak düşük fiyat salınımlarına uygulanır.
- Mevcut kapanış fiyatı bir salınımın en düşük noktasının altına düştüğünde ayı emir bloğu oluşturulur ⬇️.
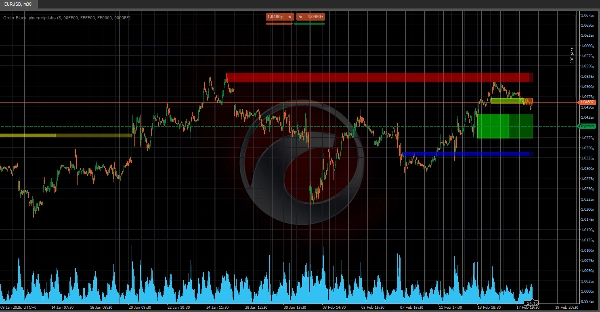
### 💼 Emir Bloğu İşlevselliği 📊
Emir Blokları, büyük piyasa oyuncularının önemli ölçüde işlem yapmış olabileceği **yüksek hacimli birikim bölgelerini** temsil eder
Bu alanlar genellikle potansiyel destek veya direnç seviyeleri olarak işlev görür ve trend devamı veya dönüş sinyali verebilir 📉📈.
- **Destek veya Direnç:** Kırılan emir blokları, önceki trende bağlı olarak ilgili destek veya direnç alanlarına işaret edebilir 🔄.
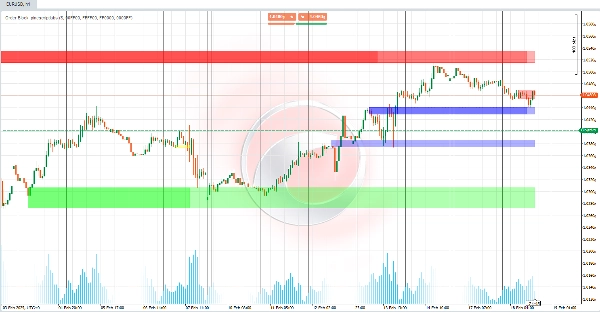
- **Devam veya Dönüş:**
- Emir bloğunun ters yönde kırılması potansiyel bir dönüşü gösterebilir 🔄.
- Aynı yönde kırılması ise trendin devamını teyit edebilir 🔗.
Bu gösterge, **grafiklerdeki önemli seviyeleri** tanımlamak için güçlüdür 📈, tüccarların yüksek hacimli bölgelerdeki fiyat davranışına dayalı önemli alanları görselleştirmesine yardımcı olur. Trendleri ve piyasa hareketlerini tespit etmek için mükemmeldir! 🎯📊
Özet
Müşteri değerlendirmeleri
5 | 100 % | |
4 | 0 % | |
3 | 0 % | |
2 | 0 % | |
1 | 0 % |


