

Açıklama
cTrader için Otomatik Trend Çizgisi Göstergesi – Piyasa Trendlerini Anında Açığa Çıkarın!
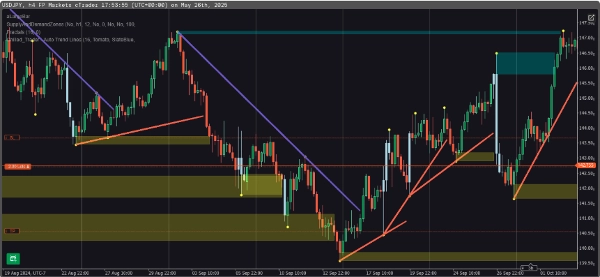
Ticareti bir üst seviyeye taşıyın Otomatik Trend Çizgisi Göstergesi ile—cTrader grafiklerinizde trend çizgilerini otomatik olarak algılayıp çizen güçlü bir araç. Artık manuel trend çizgisi çizmenize gerek yok—akıllı algoritmalar önemli piyasa trendlerini hassasiyetle belirlesin.
Özellikler:
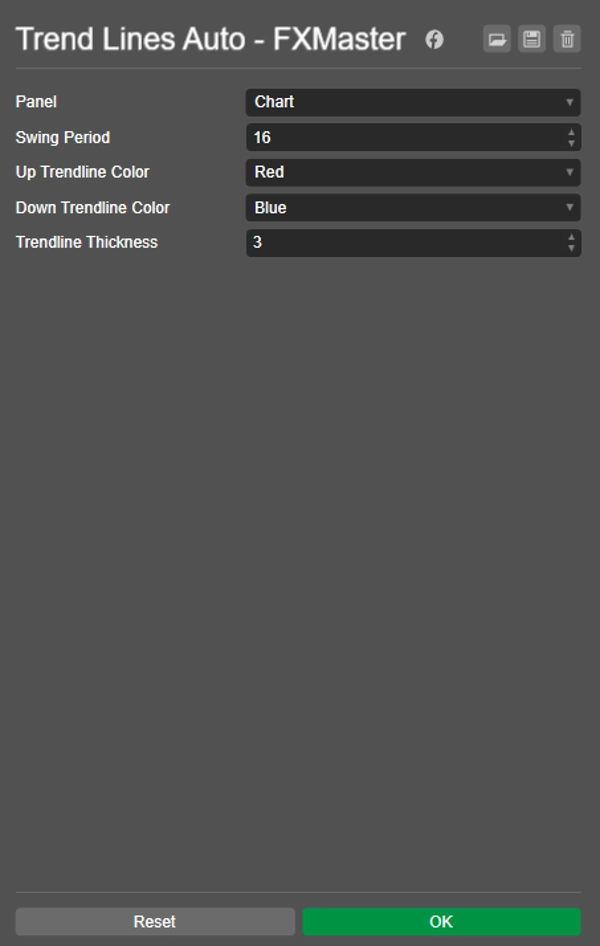
✅ Otomatik Trend Algılama – Tahmine gerek yok! Gösterge fiyat hareketlerini tarar ve anında trend çizgilerini çizer. ✅ Özelleştirilebilir Eşikler – Önemli piyasa trendlerini algılamak için hassasiyeti ayarlayın. ✅ Net Görseller – Kesintisiz grafik okunabilirliği için tercih ettiğiniz çizgi kalınlığı ve renklerini seçin. ✅ Gerçek Zamanlı Güncellemeler – Trend çizgileri dinamik olarak ayarlanarak piyasa değişimlerinin önünde olun. ✅ Her Piyasada Çalışır – Forex, Hisse Senetleri, Emtialar veya Kripto için kullanın—tüm zaman dilimlerine uyarlanabilir.
Neden Bu Göstergeleri Seçmelisiniz?
- Güvenle Ticaret Yapın – Büyük trend dönüşlerini olmadan önce tespit edin.
- Zamandan Tasarruf Edin – Trend yapılarını manuel olarak analiz etmeye gerek yok.
- Doğruluğu Artırın – Güçlü trend onayına dayalı giriş ve çıkışları geliştirmede yardımcı olur.
💡 cTrader Platformu ile Uyumludur – Profesyonel tüccarlar için zahmetsiz entegrasyon.
🔹 Bugün ticaretinizi kontrol altına alın! cTrader için Otomatik Trend Çizgisi Göstergesini edinin ve trend analizinde ustalaşın. 🚀
Özet
Key features include:
- Automatic trend detection with customizable sensitivity thresholds.
- Clear visual customization options for line thickness and colors.
- Dynamic updates that adjust trend lines as market conditions change.
- Compatibility with the cTrader platform for seamless integration.
This indicator aims to help traders identify major trend reversals early, save time by automating trend analysis, and improve trading accuracy by confirming strong trends for better entry and exit decisions.
Müşteri değerlendirmeleri
5 | 33 % | |
4 | 67 % | |
3 | 0 % | |
2 | 0 % | |
1 | 0 % |


