
HTFBB
Gösterge
1 satın almalar
Sürüm 1.0, Jul 2025
Windows, Mac
5.0
Değerlendirmeler: 1
Açıklama
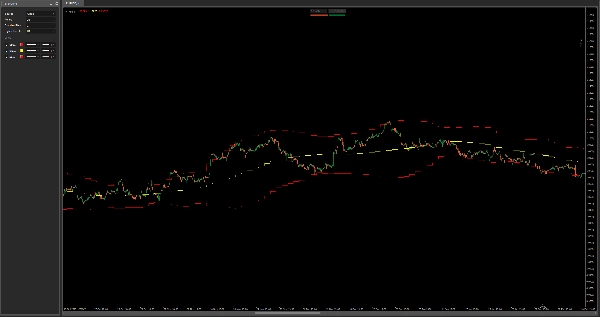
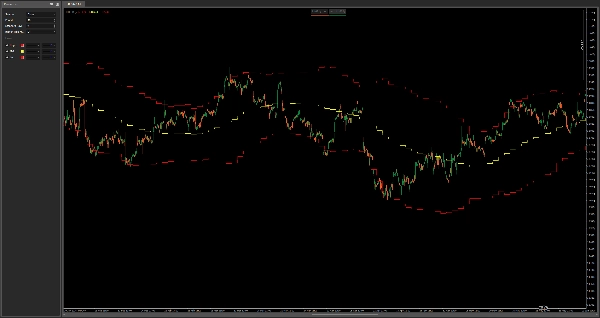
HTF Bollinger Bantları – Çok Zamanlı Volatilite Haritası
Bu gösterge, daha yüksek bir zaman diliminden Bollinger Bantlarını mevcut grafiğinize çizer, size volatilite, ortalamaya dönüş ve dinamik destek/direnç için güçlü bir bağlam sunar—tüm bunlar zaman dilimlerini değiştirmeden yapılır.
Özellikler:
- Seçilebilir herhangi bir daha yüksek zaman diliminden üst, orta ve alt Bollinger Bantlarını gösterir
- HTF konsolidasyon bölgelerini tespit etmek için mükemmeldir, kırılma baskısı ve trend geri çekilmeleri
- Daha yüksek zaman dilimi farkındalığı ile scalping ve günlük içi girişler için idealdir
- Tüm varlıklar ve zaman dilimlerinde çalışır
Mevcut stratejinizle birleştirerek volatilite tuzaklarına karşı işlem yapmaktan kaçının ve makro fiyat yapısıyla uyumlu kalın.
Özet
Gösterge profili
Müşteri değerlendirmeleri
5.0
Değerlendirmeler: 1
5 | 100 % | |
4 | 0 % | |
3 | 0 % | |
2 | 0 % | |
1 | 0 % |
Müşteri değerlendirmeleri
July 29, 2025
confusing signals get easier to ignore, but a clean signal can still fail.
Tartışma
SSS
cTrader Store üzerinden erişilebilen işlem botları, göstergeler ve eklentiler gibi ürünler, üçüncü taraf sağlayıcılar tarafından sağlanır ve yalnızca bilgilendirme ve teknik erişim amaçlarıyla sunulur. cTrader Store bir broker değildir ve yatırım tavsiyesi, kişisel öneriler vermez veya gelecekteki performansı garanti etmez.


!["[Hamster-Coder] Moving Average MTF" logosu](https://cdn.ctrader.com/image/webp/b11b98b1-194d-4b8e-b00e-d611826ad159_31226)


Fiyat
Başlangıç 03/01/2025
638.03K
İşlem hacmi
21.34K
Kazanılan pip
15
Satışlar