
VixFix
Gösterge
Sürüm 1.0, Jul 2025
Windows, Mac
4.0
Değerlendirmeler: 1
Açıklama
cTrader için VixFix Göstergesi
Haberler Gelmeden Önce Piyasa Panikini Yakalayın.
Bu VixFix göstergesi, Larry Williams’ın klasik “VIX Fix” konseptinin akıllı bir uyarlamasıdır—özellikle potansiyel piyasa diplerini tespit etmekte faydalı olan kısa vadeli korku ve volatilite sıçramalarını algılamaya yardımcı olmak için tasarlanmıştır.
Nasıl Çalışır
- Son düşük değeri, yapılandırılabilir bir dönem boyunca (varsayılan: 12) en yüksek yüksekle karşılaştırarak sözde bir volatilite sıçraması hesaplar.
- Hareketli ortalama ve standart sapma zarfı uygulayarak sinyal sıçramalarını normal gürültüden ayırır.
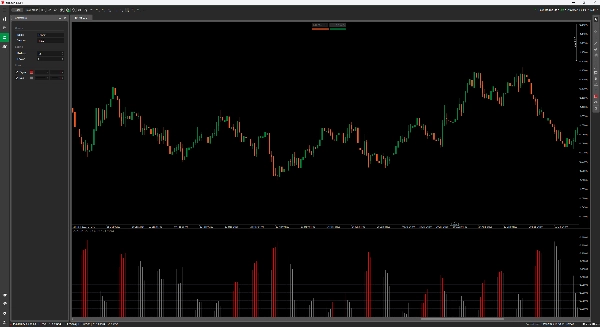
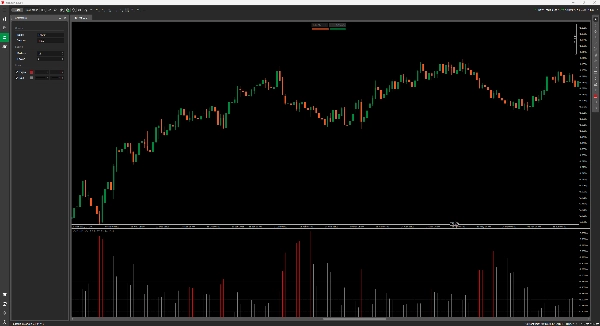
- Volatilite eşik değeri aştığında kırmızı histogram çubukları çizer—dikkat etmeye başlamanız için işaretiniz.
Özellikler
- Temiz histogram görüntüsü (bindirme yok)
- İki renkli grafik:
-
- Kırmızı = Sinyal (eşik değerin üzerindeki volatilite sıçraması)
- Gri = Normal aktivite
- Ayarlanabilir dönemler ve duyarlılık faktörü
- Sıfır gösterge gecikmesi—yalnızca ham fiyat hareketini kullanır, yeniden boyama yapmaz
Kullanım Alanları
- Düşüş trendlerinde potansiyel dönüşleri tespit edin
- Ortalama dönüş işlemlerini zamanlayın
- RSI veya diğer gecikmeli araçlara güvenmeden aşırı satım koşullarını doğrulayın
Özet
Gösterge profili
Müşteri değerlendirmeleri
4.0
Değerlendirmeler: 1
5 | 0 % | |
4 | 100 % | |
3 | 0 % | |
2 | 0 % | |
1 | 0 % |
Tartışma
SSS
cTrader Store üzerinden erişilebilen işlem botları, göstergeler ve eklentiler gibi ürünler, üçüncü taraf sağlayıcılar tarafından sağlanır ve yalnızca bilgilendirme ve teknik erişim amaçlarıyla sunulur. cTrader Store bir broker değildir ve yatırım tavsiyesi, kişisel öneriler vermez veya gelecekteki performansı garanti etmez.


Fiyat
Başlangıç 03/01/2025
638.03K
İşlem hacmi
21.34K
Kazanılan pip
15
Satışlar