

Opis
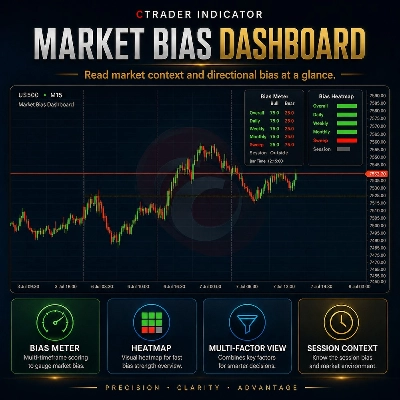
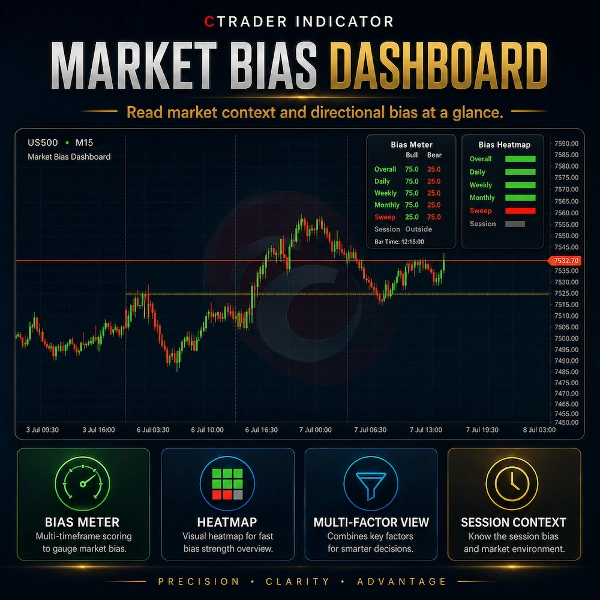
Market Bias Dashboard to wizualny wskaźnik cTrader zaprojektowany do podsumowywania kontekstu rynkowego bezpośrednio na Twoim wykresie.
Panel ocenia wybrane punkty odniesienia akcji cenowej, takie jak poziomy równowagi z poprzedniego dnia, poprzedniego tygodnia i poprzedniego miesiąca, status bieżącej sesji oraz ostatnio wykryty zasięg płynności. Wynik jest wyświetlany w przejrzystym układzie Bias Meter i Bias Heatmap.
Ważne: Wyświetlane wartości Bull/Bear nie są statystycznymi prawdopodobieństwami, danymi o nastrojach rynkowych na żywo ani prognozami skuteczności transakcji. Są to stałe wizualne stany kontekstu używane, aby ułatwić odczyt panelu.
Panel używa następującej logiki stanów:
Kontekst byczy: 75 / 25
Kontekst neutralny lub mieszany: 50 / 50
Kontekst niedźwiedzi: 25 / 75
Na przykład, jeśli cena jest powyżej wybranego poziomu równowagi, ten element może być pokazany jako kontekst byczy. Jeśli cena jest poniżej, może być pokazany jako kontekst niedźwiedzi. Jeśli kontekst jest niejasny, niedostępny lub mieszany, może być pokazany jako neutralny.
Główne cechy:
- Przejrzysty panel Bias Meter
- Panel Bias Heatmap
- Kontekst CE z poprzedniego dnia, tygodnia i miesiąca
- Widok kontekstu premii / dyskonta
- Status bieżącej sesji
- Opcjonalny kontekst zasięgu płynności
- Opcjonalne linie odniesienia
- Regulowana pozycja panelu
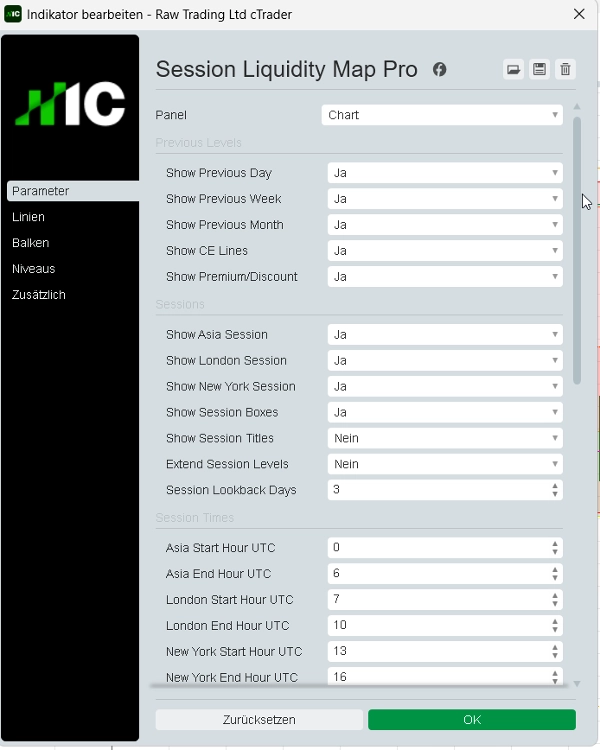
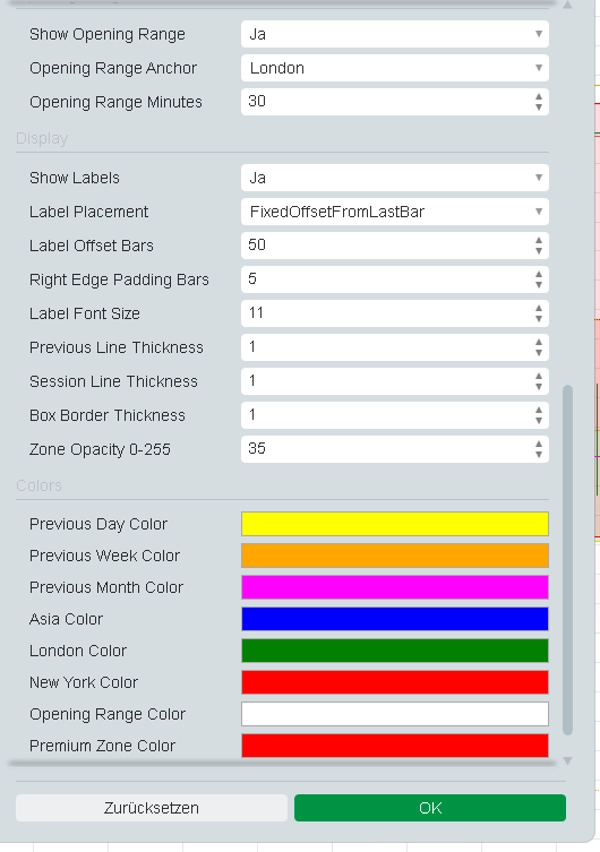
- Niestandardowe kolory i ustawienia wyświetlania
- Wskaźnik bezpieczny dla sklepu z ograniczonymi prawami dostępu
Market Bias Dashboard to wyłącznie narzędzie wizualizacji wykresu i kontekstu rynkowego. Nie wykonuje transakcji, nie modyfikuje zleceń i nie zapewnia gwarantowanych sygnałów kupna lub sprzedaży.
Trading wiąże się z ryzykiem. Ten wskaźnik nie udziela porad finansowych, rekomendacji inwestycyjnych, statystycznych prawdopodobieństw ani gwarantowanych wyników handlowych.














![Logo „Gaussian Channel [Iridio Capital]”](https://cdn.ctrader.com/image/webp/2c4f9ca9-4e9b-476d-b5a6-787c8095032b_61546)










