
LT_Ind_Candles
Indikator
4 pembelian
Versi 1.0, Sep 2024
Windows, Mac
4.0
Ulasan: 1
Penerangan
Nota: Diuji hanya pada cTrader Windows.
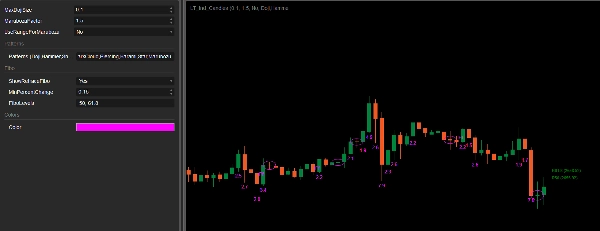
Corak Lilin Tunggal:
- Doji
- Hammer
- Bintang Menembak
Corak 2 Lilin:
- Engulf
- DarkCloud
- Piercing
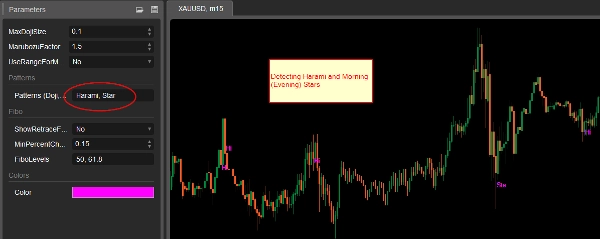
- Harami
Corak 3 Lilin:
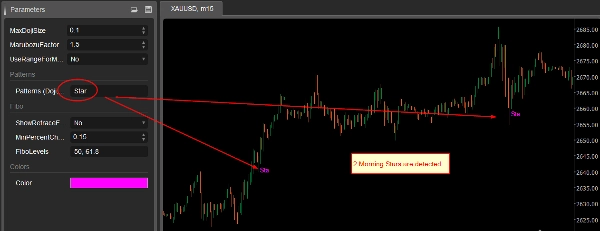
- Bintang Pagi
- Bintang Petang
Marubozu:
Jika dipilih, saiz lilin badan besar akan dianotasi. Baca penerangan tetapan untuk saiz.
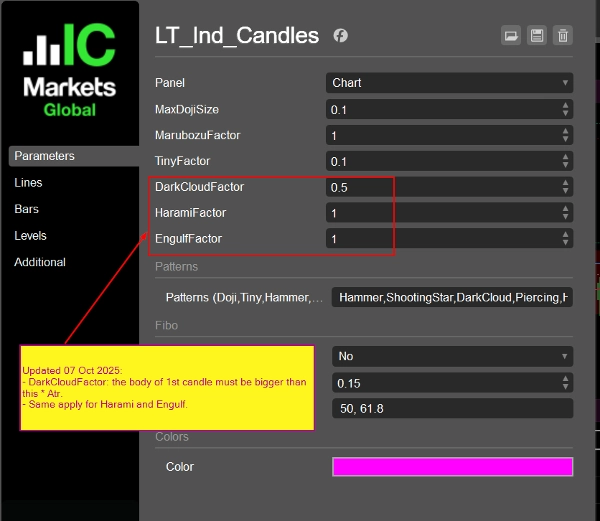
Tetapan:
(Dikemas kini 07 Okt 2025:
- Gunakan Atr (14 tempoh, purata bergerak mudah) menggantikan MedianBarBody
- Ditambah tetapan untuk faktor DarkCloud (dan Piercing), Harami, Engulf
)
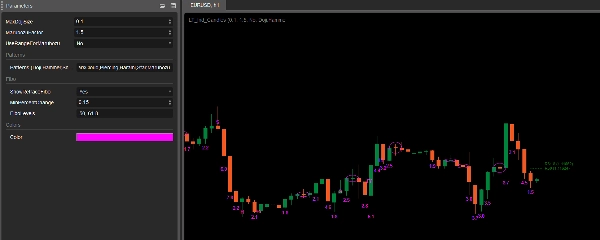
- MaxDojiSize: Nisbah maksimum antara Badan Bar ke Julat Bar untuk menganggap Doji (lalai 0.1).
- Faktor Marubozu: BarBody bar semasa mesti > MarubozuFactor * Atr untuk dianggap lilin besar (Marubozu). Kami tidak mengambil kira sumbu di sini.
- Gunakan Julat Untuk Marubozu: Gunakan BarRange (Tinggi - Rendah) menggantikan BarBody (Buka - Tutup).MathAbs() apabila memeriksa Marubozu.
- Corak: letakkan corak yang anda ingin kesan, dipisahkan dengan koma. Nilai diterima adalah: Doji,Hammer,ShootingStar,Engulf,DarkCloud,Piercing,Harami,Star,Marubozu. Perlu diingat jika memilih "Star", kedua-dua Bintang Pagi dan Bintang Petang akan dikesan.
- Tunjukkan Retrace Fibo: Tahap Fibo pembantu untuk membantu anda mengawal risiko. Apabila terdapat 2 lilin berturut-turut dengan Tinggi Lebih Tinggi dan Rendah Lebih Tinggi, tahap Fibo yang ditentukan dikira dari 2 lilin itu akan dipaparkan. Anda boleh menahan kemasukan anda sehingga harga mencapai tahap tersebut untuk mengawal risiko. Tahap boleh ditetapkan. Sebelah bertentangan adalah sama (Tinggi Lebih Rendah dan Rendah Lebih Rendah).
- Perubahan Peratus Minimum: 2 lilin yang digunakan untuk tahap Fibo mesti membentuk perubahan harga > peratus ini.
- Tahap Fibo: letakkan tahap anda dipisahkan dengan koma.
- Warna: warna anotasi lilin.
Ringkasan
Profil indikator
Ulasan pelanggan
4.0
Ulasan: 1
5 | 0 % | |
4 | 100 % | |
3 | 0 % | |
2 | 0 % | |
1 | 0 % |
Perbincangan
Soalan Lazim
Forex
Signal
Indices
Commodities
Crypto
Stocks
ATR
Produk yang tersedia melalui cTrader Store, termasuk bot dagangan, indikator dan plugin, disediakan oleh pembangun pihak ketiga dan diberikan akses untuk tujuan maklumat dan teknikal sahaja. cTrader Store bukan broker dan tidak memberikan nasihat pelaburan, syor peribadi atau sebarang jaminan prestasi masa hadapan.


![Logo "Gaussian Channel [Iridio Capital]"](https://cdn.ctrader.com/image/webp/7c039209-5573-4a54-a072-f9528b503103_41960)


Harga
Sejak 25/09/2024
34
Jualan