
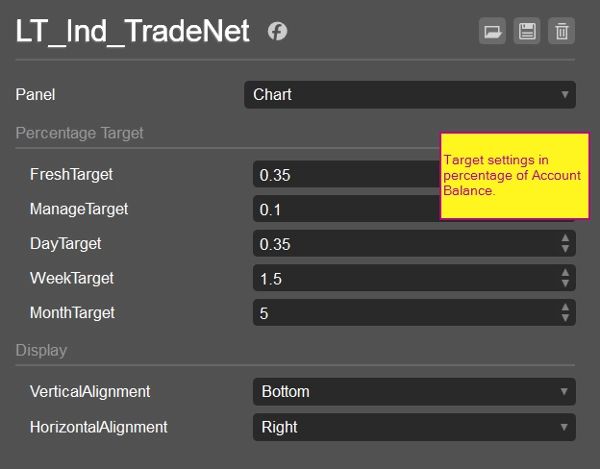
LT_Ind_TradeNet
Indikator
1 pembelian
Versi 1.0, Oct 2025
Windows, Mac
5.0
Ulasan: 1
Penerangan
Nota: Diuji hanya pada cTrader Windows.
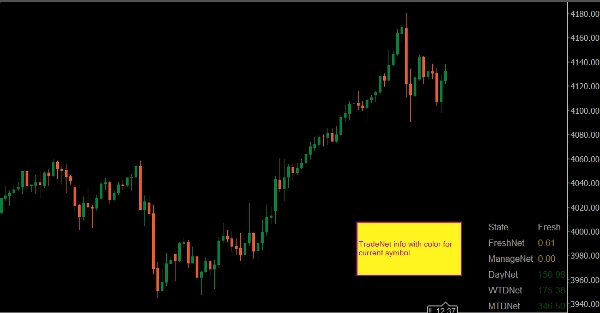
LT_Ind_TradeNet adalah penunjuk penjejakan keuntungan yang fokus untuk satu simbol dagangan.
Ia membantu pedagang kekal berdisiplin dengan menunjukkan berapa banyak yang telah mereka peroleh untuk hari, minggu, dan bulan semasa — dipisahkan kepada keadaan dagangan yang jelas.
Keadaan
- NoTrade – tiada posisi terbuka
- Fresh – dagangan baru ke arah sasaran hari
- Manage – mengurus dagangan sedia ada atau bertindih
- Leftover – dagangan yang tinggal selepas sasaran atau akhir sesi
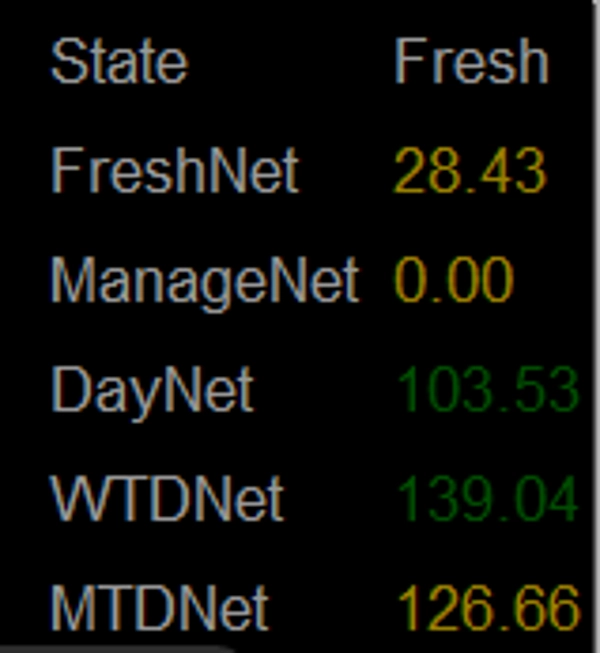
Metrik Dipaparkan
- FreshNet – keuntungan bersih dari dagangan sebelah tunggal
- ManageNet – keuntungan bersih dari semua dagangan bertindih (kedua-dua belah)
- DayNet – jumlah keuntungan untuk hari semasa
- WTDNet – keuntungan minggu hingga tarikh
- MTDNet – keuntungan bulan hingga tarikh
Tujuan
- Menjaga pedagang fokus pada matlamat harian atau mingguan yang realistik
- Mengurangkan tingkah laku emosi dan tamak dengan menentukan titik “cukup” yang jelas
- Memberi maklum balas mudah untuk memutuskan sama ada untuk terus berdagang atau berhenti untuk sesi tersebut
Sorotan
- Spesifik simbol: setiap carta menunjukkan prestasi sendiri
- Ringan dan tidak mengganggu
- Sesuai untuk pedagang langsung yang mengikuti matlamat keuntungan harian/mingguan yang terstruktur
Prinsip Teras:
Cukup adalah titik utama untuk menang.
Ringkasan
Profil indikator
Ulasan pelanggan
5.0
Ulasan: 1
5 | 100 % | |
4 | 0 % | |
3 | 0 % | |
2 | 0 % | |
1 | 0 % |
Perbincangan
Soalan Lazim
Prop
Forex
Indices
Commodities
Crypto
Stocks
Produk yang tersedia melalui cTrader Store, termasuk bot dagangan, indikator dan plugin, disediakan oleh pembangun pihak ketiga dan diberikan akses untuk tujuan maklumat dan teknikal sahaja. cTrader Store bukan broker dan tidak memberikan nasihat pelaburan, syor peribadi atau sebarang jaminan prestasi masa hadapan.


Harga
Sejak 25/09/2024
34
Jualan