
คำอธิบาย
เครื่องตรวจจับแท่งเทียนใหญ่
(โดย Avydel Talbo – เทรดเดอร์ Prop Firm ที่ The5%ers & OFP)
ตอนนี้พร้อมใช้งานสำหรับ cTrader!
พัฒนาเดิมสำหรับ MT5, เครื่องตรวจจับแท่งเทียนใหญ่ ATR โดย Avydel Talbo เป็นเครื่องมือที่แข็งแกร่งออกแบบมาเพื่อช่วยเทรดเดอร์ระบุโซนราคาหลักและรูปแบบแท่งเทียนสำคัญได้อย่างมีประสิทธิภาพและแม่นยำ
ภาพรวม
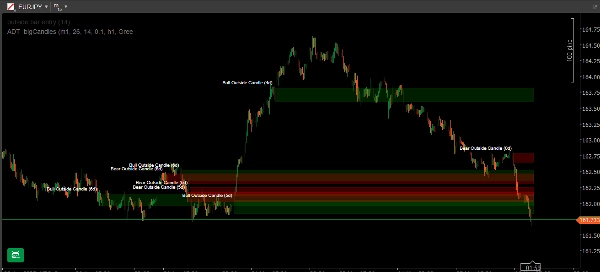
เครื่องตรวจจับแท่งเทียนใหญ่ ATR จะสแกนกราฟของคุณเพื่อหาแท่งเทียนที่ใหญ่ที่สุดและสำคัญที่สุดภายในช่วงเวลาที่ผู้ใช้กำหนด โดยใช้ค่า Average True Range (ATR) เป็นตัวกรองความผันผวน มันจะเน้นแท่งเทียน “ใหญ่” เหล่านี้ด้วยสี่เหลี่ยมสีที่คงอยู่ แต่ละโซนจะถูกติดป้ายด้วยประเภทของรูปแบบแท่งเทียนและอายุของแท่งเทียนนั้น เพื่อให้บริบทที่ชัดเจนสำหรับเทรดเดอร์ทุกระดับ
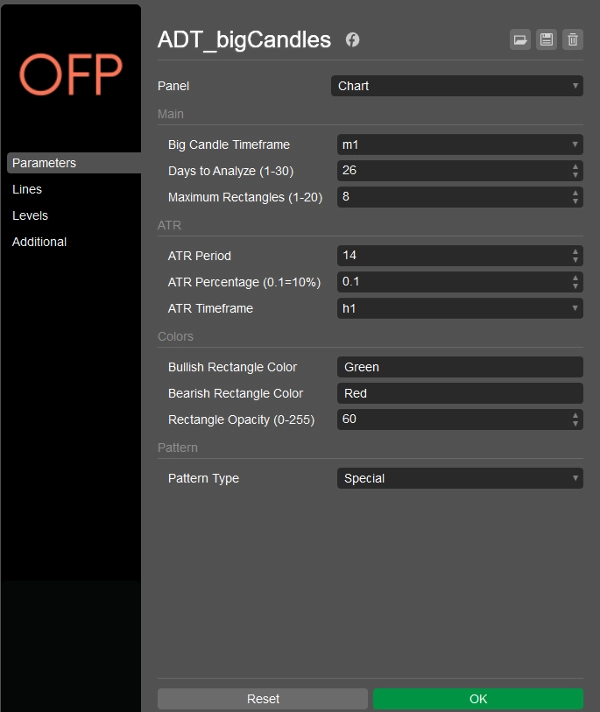
คุณสมบัติหลัก
- การกรองโดยใช้ ATR:
ตรวจจับเฉพาะแท่งเทียนที่เกินเกณฑ์ ATR ที่ปรับแต่งได้ มุ่งเน้นไปที่การเคลื่อนไหวที่สำคัญจริงๆ - การตรวจจับรูปแบบหลายแบบ:
-
- โหมดมาตรฐาน: ค้นหาแท่งเทียนทั้งหมดที่ตรงตามเกณฑ์ ATR
- โหมดพิเศษ: กรองรูปแบบราคาคลาสสิก เช่น Outside Bars, Engulfing Candles, Doji, Marubozu, Hammer, Shooting Star, Pin Bars และ Spinning Top (ติดป้ายอัตโนมัติ)
- สี่เหลี่ยมที่คงอยู่:
ทำเครื่องหมายแท่งเทียนใหญ่แต่ละแท่งด้วยสี่เหลี่ยมสี (กระทิงหรือหมี) ที่คงอยู่บนกราฟเพื่อการอ้างอิง เหมาะสำหรับการทำแผนที่โซนอุปทาน/อุปสงค์และโซนแนวรับ/แนวต้าน - การตั้งค่าที่ปรับแต่งได้:
ปรับช่วงเวลา วันในการสแกน ช่วงเวลา ATR ลักษณะสี่เหลี่ยม และอื่นๆ - การจัดการการทับซ้อน:
ป้องกันการทับซ้อนของสี่เหลี่ยมชนิดเดียวกันเพื่อให้กราฟสะอาด - การติดป้ายรูปแบบ:
แต่ละโซนจะติดป้ายด้วยทิศทาง ประเภทรูปแบบ และจำนวนวันที่ผ่านมา
วิธีการทำงาน
- สแกนแท่งเทียนล่าสุด (ย้อนหลังได้ถึง 30 วัน) บนช่วงเวลาที่คุณเลือก
- คำนวณ ATR เพื่อกำหนดเกณฑ์ช่วงไดนามิก
- ตรวจจับและจัดอันดับแท่งเทียนที่ใหญ่ที่สุดตามช่วง
- วาดและติดป้ายสี่เหลี่ยมเพื่อการวิเคราะห์อย่างรวดเร็ว
เหมาะสำหรับใคร?
- เทรดเดอร์ Prop firm และรายย่อยที่ทำแผนที่การเคลื่อนไหวของสถาบัน
- เทรดเดอร์วิเคราะห์ราคาและวิเคราะห์ทางเทคนิค
- ใครก็ตามที่ต้องการอัตโนมัติการระบุแท่งเทียนและโซนที่มีผลกระทบสูง
เกี่ยวกับผู้เขียน:
เทรดเดอร์ Prop firm มืออาชีพที่ The5%ers และ OFP มีประสบการณ์กว้างขวางในการวิเคราะห์ราคาและการเทรดโซน ตัวชี้วัดนี้พัฒนาขึ้นจากความต้องการเทรดจริงและใช้ในสภาพแวดล้อมการเทรดสดทุกวัน
เหมาะสำหรับเทรดเดอร์ที่ต้องการอัตโนมัติการตรวจจับโซนและเพิ่มประสิทธิภาพการวิเคราะห์ราคา
สรุป
Key features include two detection modes: Standard Mode, which finds all candles exceeding the ATR threshold, and Special Mode, which filters classic price action patterns such as Outside Bars, Engulfing Candles, Doji, Marubozu, Hammer, Shooting Star, Pin Bars, and Spinning Top, with automatic labeling. The indicator prevents overlapping rectangles of the same type for chart clarity and allows customization of timeframe, ATR period, scan duration, and rectangle appearance. Each highlighted zone is labeled with candle direction, pattern type, and age.
This tool is suitable for prop firm and retail traders focused on price action and technical analysis, particularly those automating the identification of high-impact candles and zones for enhanced trading decisions.
รีวิวจากลูกค้า
5 | 100 % | |
4 | 0 % | |
3 | 0 % | |
2 | 0 % | |
1 | 0 % |


