
Daily SD Levels - Indicator
อินดิเคเตอร์
4 การซื้อ
เวอร์ชัน 1.0, Aug 2025
Windows, Mac
5.0
รีวิว: 1
คำอธิบาย
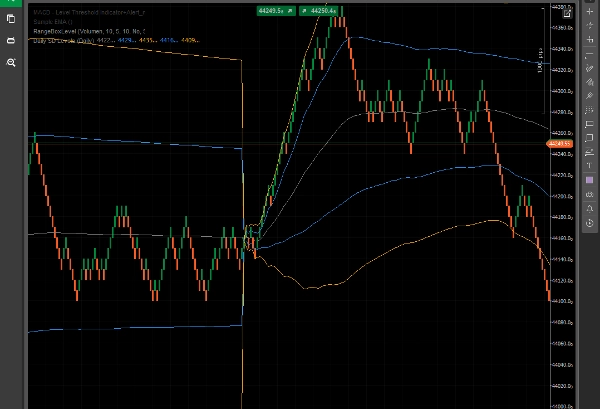
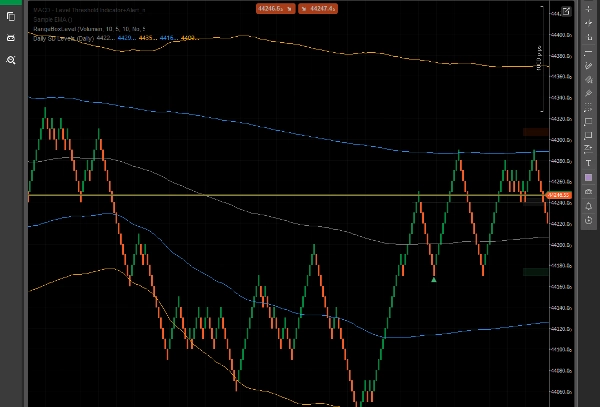
ระดับ SD รายวัน – แถบส่วนเบี่ยงเบนมาตรฐานแบบไดนามิกที่อิง VWAP
ตัวชี้วัด ระดับ SD รายวัน แสดงผล VWAP (ราคาเฉลี่ยถ่วงน้ำหนักด้วยปริมาณ) แบบไดนามิก และ แถบส่วนเบี่ยงเบนมาตรฐาน (+1/+2 และ -1/-2) ที่คำนวณจากวันซื้อขายปัจจุบัน
เครื่องมือนี้ช่วยให้ผู้ซื้อขาย ประเมินความผันผวนภายในวันอย่างชัดเจน, โซน แนวรับ/แนวต้านที่เป็นไปได้ และ ราคาสูงสุดต่ำสุด ทั้งหมดนี้อิงจากปริมาณตลาดและการเคลื่อนไหวของราคาในความเป็นจริง – ไม่ใช่ระดับที่กำหนดตายตัวหรือสุ่ม
คุณสมบัติหลัก:
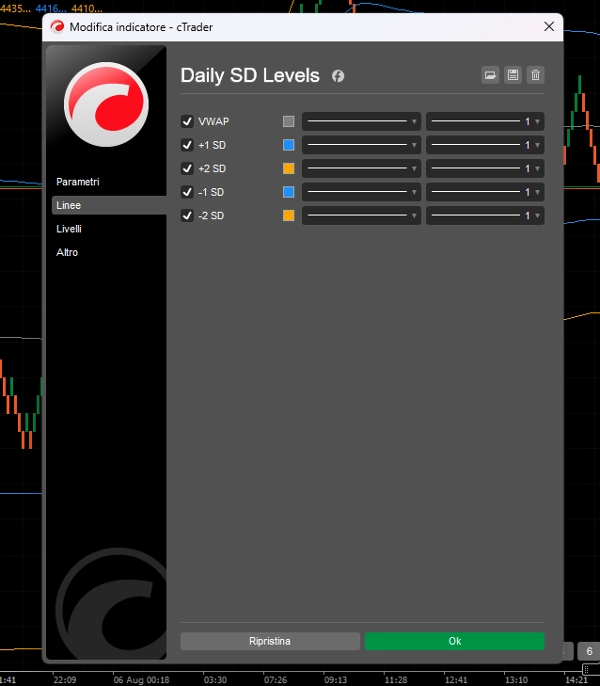
- เส้น VWAP สำหรับติดตามมูลค่ายุติธรรมภายในวัน
- แถบ SD +1/+2 และ -1/-2 เพื่อระบุโซนที่ซื้อมากเกินไป/ขายมากเกินไป
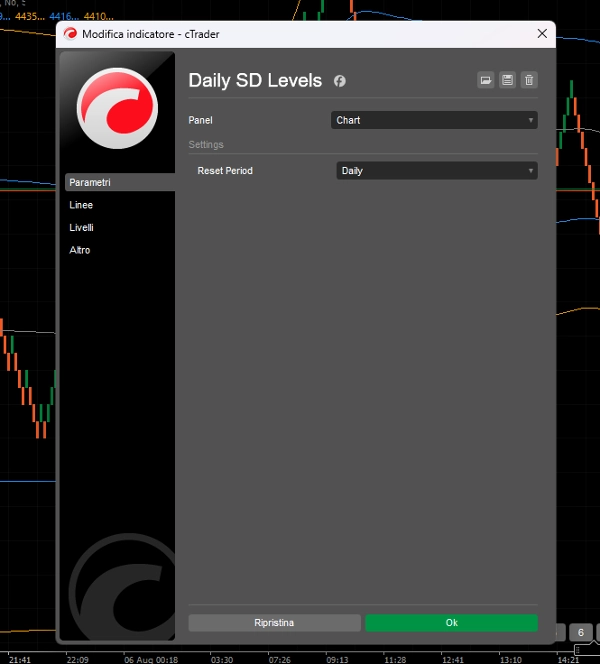
- ระดับ รีเซ็ตทุกวัน ปรับตามไดนามิกของราคาและปริมาณในแต่ละช่วงเวลา
- ปรับแต่งสำหรับ Renko, Range Bar และการซื้อขายภายในวัน.
- สร้างขึ้นสำหรับผู้ซื้อขายที่ต้องการ ความชัดเจนและโซนราคาที่ไดนามิก.
ตัวชี้วัดนี้เหมาะสำหรับ:
- การตั้งค่าการกลับตัวเข้าสู่ค่าเฉลี่ย
- การระบุการเคลื่อนไหวที่ยืดออกเพื่อการกลับตัวที่เป็นไปได้
- การยืนยันด้วยสายตาของการเบรกเอาท์ที่เกินขอบเขตทางสถิติ
ไม่มีความรก เพียงแค่ ระดับที่สะอาดและตอบสนอง ที่เคลื่อนไหวตามตลาด
สรุป
โปรไฟล์อินดิเคเตอร์
รีวิวจากลูกค้า
5.0
รีวิว: 1
5 | 100 % | |
4 | 0 % | |
3 | 0 % | |
2 | 0 % | |
1 | 0 % |
รีวิวจากลูกค้า
August 8, 2025
it gives context without making the decision, but the chart still needs a human read.
การสนทนา
คำถามที่พบบ่อย
ผลิตภัณฑ์ที่มีให้บริการผ่าน cTrader Store รวมถึงบอทการเทรด อินดิเคเตอร์ และปลั๊กอิน มีให้บริการโดยนักพัฒนาบุคคลที่สามและมีไว้เพื่อวัตถุประสงค์ในการเข้าถึงข้อมูลและทางเทคนิคเท่านั้น cTrader Store ไม่ใช่โบรกเกอร์และไม่ได้ให้คำแนะนำการลงทุน คำแนะนำส่วนบุคคล หรือการรับประกันผลการดำเนินงานในอนาคต


ราคา
ตั้งแต่ 16/07/2025
5
การขาย