
JMA-Like
อินดิเคเตอร์
1 การซื้อ
เวอร์ชัน 1.0, Aug 2025
Windows, Mac
5.0
รีวิว: 1
คำอธิบาย
JMA-Like – ค่าเฉลี่ยเคลื่อนที่แบบปรับตัวไม่มีดีเลย์
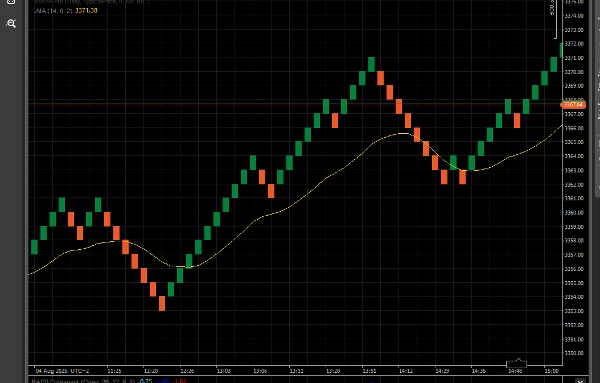
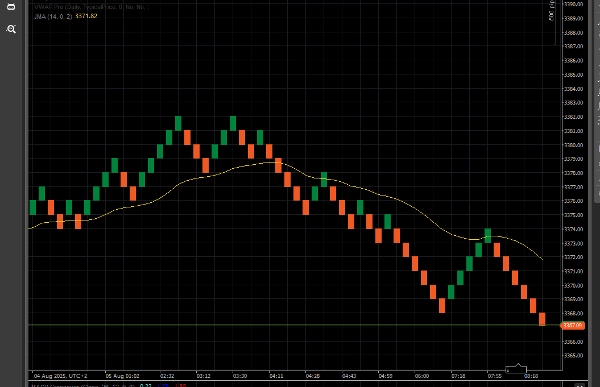
JMA Advanced เป็นค่าเฉลี่ยเคลื่อนที่ที่ตอบสนองสูงและเรียบเนียนอย่างมาก ออกแบบมาเพื่อเลียนแบบพฤติกรรมของ Jurik Moving Average (JMA) ดั้งเดิม มันปรับตัวตามความผันผวนของตลาดอย่างไดนามิก ลดดีเลย์ในขณะที่กรองเสียงรบกวนออก
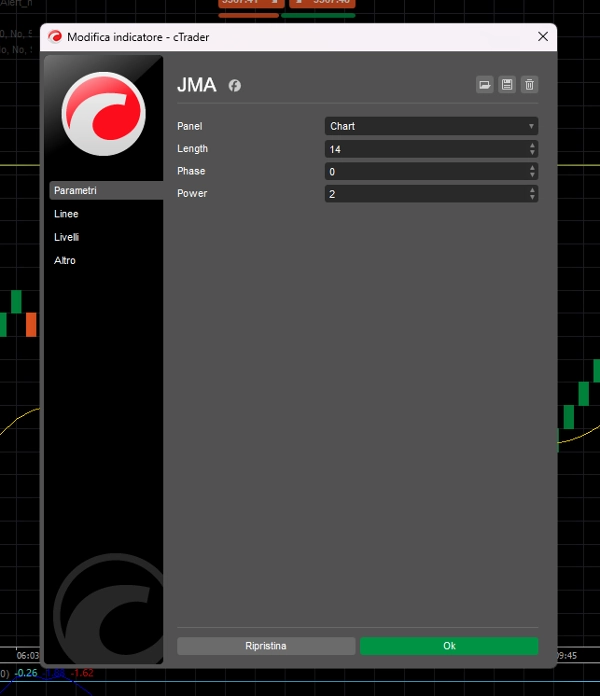
สร้างขึ้นด้วยอัลกอริทึมการปรับเรียบขั้นสูง JMA Advanced เหมาะสำหรับทั้งกลยุทธ์ติดตามแนวโน้มและกลยุทธ์ตรงข้าม รวมถึงพารามิเตอร์ Phase และ Power ที่ปรับได้เพื่อควบคุมการตอบสนองและการเกิน ทำให้เหมาะสำหรับเทรดเดอร์ Renko, ช่วงราคา และการเคลื่อนไหวของราคา
✅ ความรู้สึกไม่มีดีเลย์
✅ ปรับตัวตามความผันผวน
✅ ใช้งานได้กับทุกกรอบเวลาและประเภทกราฟ
✅ ปรับแต่งได้อย่างเต็มที่
สรุป
สรุปโดย AI
JMA-Like is an adaptive zero-lag moving average indicator designed to replicate the behavior of the original Jurik Moving Average (JMA). It features advanced smoothing algorithms that dynamically adjust to market volatility, reducing lag while filtering out noise. The indicator includes customizable Phase and Power parameters, allowing users to control responsiveness and overshoot. It is suitable for various trading styles, including trend-following and contrarian strategies, and works effectively on all timeframes and chart types such as Renko, range, and price action charts. Key features include a zero-lag feel, volatility adaptation, and full customization options.
โปรไฟล์อินดิเคเตอร์
รีวิวจากลูกค้า
5.0
รีวิว: 1
5 | 100 % | |
4 | 0 % | |
3 | 0 % | |
2 | 0 % | |
1 | 0 % |
รีวิวจากลูกค้า
การสนทนา
คำถามที่พบบ่อย
ผลิตภัณฑ์ที่มีให้บริการผ่าน cTrader Store รวมถึงบอทการเทรด อินดิเคเตอร์ และปลั๊กอิน มีให้บริการโดยนักพัฒนาบุคคลที่สามและมีไว้เพื่อวัตถุประสงค์ในการเข้าถึงข้อมูลและทางเทคนิคเท่านั้น cTrader Store ไม่ใช่โบรกเกอร์และไม่ได้ให้คำแนะนำการลงทุน คำแนะนำส่วนบุคคล หรือการรับประกันผลการดำเนินงานในอนาคต
เพิ่มเติมจากผู้เขียนคนนี้


ราคา
ตั้งแต่ 16/07/2025
5
การขาย