
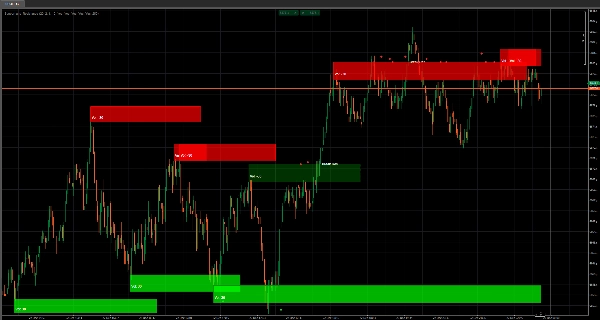
✅ กล่องแนวรับและแนวต้านที่มีปริมาณสูง — ทำแผนที่โซน “ป้องกัน / แตก” จริงโดยอัตโนมัติ
✅ ความแข็งแกร่งของโซนถ่วงน้ำหนักด้วยปริมาณ (ความทึบแบบไดนามิก) — ปริมาณมาก = การปรากฏของกล่องที่แข็งแกร่งขึ้น
✅ การสร้างโซนโดยใช้จุดหมุน (Lookback) — เฉพาะระดับที่ได้รับการยืนยันเท่านั้นที่จะกลายเป็นโซน (ลดเสียงรบกวน)
✅ ความกว้างของกล่องปรับได้ (อิงตาม ATR) — โซนปรับขนาดตามความผันผวนปัจจุบัน ไม่ใช่การเดาคงที่
✅ การขยายกล่องแบบสด — โซนยังคงฉายไปข้างหน้าเมื่อราคาพัฒนา
✅ ความฉลาดในการแตก / ถือ — ตรวจจับว่าโซนถือหรือแตกและตอบสนองทันที
✅ เครื่องหมายเหตุการณ์แบบภาพ (รูปเพชร) — การยืนยัน “ถือ / พลิก” ที่ชัดเจนโดยไม่ต้องคิดมาก
✅ ป้ายแตก — เหตุการณ์ “Break Sup / Break Res” ที่ชัดเจนบนแผนภูมิ
✅ การควบคุมภาพเต็มรูปแบบ — สลับเปิด/ปิดสำหรับกล่อง / ข้อความปริมาณ / รูปเพชร / ป้ายแตก
✅ ระบบทำความสะอาดอัตโนมัติ — ป้องกันความยุ่งเหยิงบนแผนภูมิด้วยการลบเครื่องหมายเหตุการณ์เก่าโดยอัตโนมัติ
✅ การควบคุมจำนวนกล่องสูงสุด — จำกัดอย่างเข้มงวดเพื่อรักษาประสิทธิภาพให้รวดเร็วและแผนภูมิเข้าใจง่าย
แนวรับและแนวต้าน (กล่องปริมาณสูง) ไม่ใช่เครื่องมือ S/R พื้นฐานที่แสดงเส้นสุ่ม
ตัวบ่งชี้นี้ถูกสร้างขึ้นเพื่อแสดงสิ่งที่มีค่ามากกว่านั้น:
ที่ที่ราคาสร้างความสนใจจริง — และที่ที่มีแนวโน้มจะตอบสนองอีกครั้งมากที่สุด
แทนที่จะวาด “ระดับสวยงาม” มันสร้าง โซนอุปทานและอุปสงค์ที่มีปริมาณสูง เป็น กล่องตรงบนแผนภูมิของคุณ เพื่อให้คุณสามารถเทรดโครงสร้างเหมือนมืออาชีพ:
ระบุโซน → ดูปฏิกิริยา → เทรดการถือหรือการแตก
ข้อได้เปรียบหลัก: ปริมาณ + โครงสร้าง ไม่ใช่การเดา
ทุกกล่องถูกสร้างขึ้นเมื่อเงื่อนไขสองอย่างตรงกัน:
- จุดหมุนที่ได้รับการยืนยัน (โครงสร้างสำคัญ)
- ปริมาณสูงสุด (ความสนใจสำคัญ)
นั่นหมายความว่าคุณจะไม่ถูกส่งโซนที่อ่อนแอมากมาย
คุณจะได้โซนน้อยลง — แต่โซนที่คุณได้คือโซนที่สำคัญจริงๆ
ความแข็งแกร่งที่คุณเห็นได้ (ความทึบ = พลัง)
นี่คือจุดที่มันไม่ยุติธรรมสำหรับคนที่เทรด S/R แบบ “ตาบอด”
ความทึบของกล่องเติมปรับตามปริมาณ ดังนั้นคุณจะรู้ทันทีว่า:
- กล่องจาง = ความสนใจน้อย (จับตาดูไว้)
- กล่องแข็งแรง = ความสนใจมาก (เคารพมัน)
ไม่มีตัวบ่งชี้เพิ่มเติม ไม่มีการตีความซับซ้อน — มันเห็นได้ชัดเจนจริงๆ
โซนปรับตามความผันผวน (ความกว้าง ATR)
ตลาดไม่ได้เคลื่อนไหวเหมือนกันทุกวัน
ตัวบ่งชี้นี้ปรับความหนาของกล่องโดยใช้ฐาน ATR ยาว ดังนั้นโซนจะขยายหรือหดตัวตามความผันผวน
ผลลัพธ์:
โซนยังคงสมจริง แทนที่จะบางเกินไปจนไม่มีความหมายหรือกว้างเกินไปจนไร้ประโยชน์
ความฉลาดในการถือกับการแตก (และการตอบสนองภาพทันที)
โซนมีค่าเฉพาะเมื่อคุณอ่านได้ว่าราคาทำอะไรกับมัน
ตัวบ่งชี้นี้ติดตาม:
- การถือ (การปฏิเสธ / การเคารพ)
- การแตกออก (การยอมรับผ่านโซน)
…และจากนั้น อัปเดตสไตล์แบบสด:
- การถือรักษา “ตัวตนแนวรับ/แนวต้าน” เดิมไว้
- การแตกพลิกพฤติกรรม (แนวรับอาจกลายเป็นแนวต้านและในทางกลับกัน)
- สไตล์การแตกสามารถเปลี่ยนเป็นเส้นประ + โทนสีใหม่เพื่อให้คุณรู้ทันทีว่า:
“ระดับนี้เพิ่งเปลี่ยนลักษณะ”
รูปเพชร + ป้ายแตก: ตัวกระตุ้นการตัดสินใจที่ชัดเจน
คุณจะได้รับเครื่องหมายเหตุการณ์ที่สัญญาณชัดเจนและเรียบง่าย:
- รูปเพชร เพื่อเน้นเหตุการณ์ถือ/พลิก
- ป้ายแตก เพื่อให้คุณไม่พลาดช่วงเวลาที่ระดับแตก
มันคือความแตกต่างระหว่าง คิดว่า ว่าบางอย่างแตก… และ รู้ ว่ามันแตกจริงๆ
สร้างมาเพื่อการเทรดจริง: การควบคุม + แผนภูมิที่สะอาด
ตัวบ่งชี้นี้ถูกออกแบบมาให้ใช้งานได้หลังจากเทรดเป็นเวลานาน:
- ต้องการแค่โซน? ปิดรูปเพชร/ป้าย
- ต้องการสัญญาณบริสุทธิ์? ปิดข้อความปริมาณ
- ต้องการประสิทธิภาพ? จำกัด จำนวนกล่องสูงสุด.
- เกลียดความยุ่งเหยิง? ระบบทำความสะอาดอัตโนมัติ ช่วยให้แผนภูมิเคลียร์โดยลบเครื่องหมายเก่าโดยอัตโนมัติ
คุณจะโฟกัสกับการต่อสู้ปัจจุบัน — ไม่จมอยู่กับประวัติศาสตร์
การตั้งค่าที่แนะนำ (เริ่มต้นอย่างรวดเร็ว)
✅ ช่วงเวลาย้อนกลับ: 20 (การยืนยันที่สมดุล)
✅ ความยาวตัวกรองปริมาณ: 2 (ตอบสนองเร็ว)
✅ ตัวคูณความกว้างกล่อง: 1.0 (เป็นกลาง)
✅ แสดงกล่อง: เปิด
✅ รูปเพชร + ป้ายแตก: เปิด (จนกว่าคุณจะเรียนรู้พฤติกรรม จากนั้นปรับปรุง)
✅ ระบบทำความสะอาดอัตโนมัติ: เปิด (รักษาความสะอาด)
สิ่งที่ตัวบ่งชี้นี้มอบให้คุณจริงๆ
แผนที่ภาพของ ที่ที่ตลาดแสดงไพ่ของมัน — และการอ่านสดว่าราคากำลัง เคารพ โซนนั้นหรือ ทำลาย มัน
ถ้าคุณเทรดการแตก การดึงกลับ การกลับตัว หรือการทดสอบซ้ำ:
นี่จะกลายเป็น “แผนที่สนามรบ” ของคุณ


