
SR COMMANDER — إصدار متعدد الأطر الزمنية
شاهد أين يرسم المال الكبير الخط. تداول على الإطار الزمني الخاص بك. فكر على إطاره.
معظم أدوات الدعم والمقاومة مرتبطة بإطار الرسم البياني الزمني الخاص بك. إذا كنت تقوم بالتداول السريع على M1، فإن مستويات الدعم/المقاومة الخاصة بك تأتي من شموع M1 — صغيرة، صاخبة، وسهلة التزوير. SR Commander MTF يكسر هذا القيد.
قم بضبط الرسم البياني الخاص بك على M1. اضبط إطار الدعم/المقاومة على H1. الآن أنت تتداول بدقة مخطط الدقيقة الواحدة، لكن مستويات الدعم والمقاومة الخاصة بك مستمدة من شموع الساعة حيث تتخذ المؤسسات والخوارزميات والمتداولون المحترفون قراراتهم فعليًا. هذه هي الميزة.
كيف يعمل محرك الأطر الزمنية المتعددة
المؤشر يشغل تدفقين مستقلين من البيانات في نفس الوقت.
إطار الرسم البياني الزمني يتحكم فيما تراه — شموعك، دخولك، سهامك، توقيتك. إطار الدعم/المقاومة الزمني يتحكم من أين تأتي المستويات. يتم مطابقة هذين التدفقين مع بعضهما البعض في الوقت الحقيقي، شمعة تلو الأخرى. عندما تغلق شمعة جديدة على الرسم البياني، ينظر SR Commander إلى شمعة إطار الدعم/المقاومة الصحيح لذلك اللحظة بالذات ويعيد حساب المستويات من هيكل الإطار الزمني الأعلى.
هذا يعني أن خط الدعم الأخضر وخط المقاومة الأحمر يعكسان دائمًا الهيكل المرجح بالتقلبات لإطار الدعم/المقاومة الذي اخترته — وليس ضوضاء الرسم البياني الذي تشاهده.
العلم وراء المستويات
SR Commander لا يرسم خطوطًا فقط عند القمم والقيعان المتأرجحة. إنه يستخدم نموذج تقلبات Yang-Zhang — نفس فئة مقدر التقلبات المستخدمة في الأبحاث الكمية المهنية — لحساب الوزن الإحصائي الحقيقي لكل شمعة. كل مستوى مشتق من هيكل السعر الموحد، مع الأخذ في الاعتبار الفجوات الليلية، حركة الافتتاح إلى الإغلاق، ونطاق الشمعة. النتيجة هي مستويات تحمل دلالة رياضية حقيقية، وليس مجرد بروز بصري.
ما تراه على الرسم البياني
- 🟢 خط الدعم الأخضر — أقرب أرضية ذات دلالة إحصائية تحت السعر الحالي، مأخوذة من إطار الدعم/المقاومة الزمني الذي اخترته
- 🔴 خط المقاومة الأحمر — أقرب سقف ذو دلالة إحصائية فوق السعر الحالي، مأخوذ من إطار الدعم/المقاومة الزمني الذي اخترته
- ⬆️ إشارة شراء — تنطلق عندما يرتد السعر من الدعم مع إغلاق صعودي مؤكد على شمعة إطار الدعم/المقاومة
- ⬇️ إشارة بيع — تنطلق عندما يرفض السعر المقاومة مع إغلاق هبوطي مؤكد على شمعة إطار الدعم/المقاومة
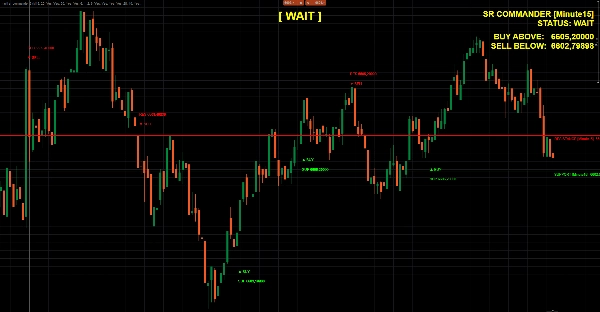
- 📊 لوحة تحكم حية — تعرض إطار الدعم/المقاومة النشط، الحالة الحالية، وأسعار تفعيل الاختراق الدقيقة
- 🔵 ملصق حالة كبير — شراء / بيع / انتظار، يتم تحديثه كل شمعة في أعلى وسط الرسم البياني الخاص بك
- 🕓 تراكب تاريخي — ارتدادات، رفضات، اختراقات وانهيارات معلمة على الرسم البياني للتحقق البصري الفوري
تركيبات الأطر الزمنية التي تعمل
الرسم البياني TFSR الإطار الزمنيحالة الاستخدام
M1
M5 أو M15
تداول سريع مع هيكل قصير الأجل
M5
H1
تداول داخل اليوم مع مستويات كل ساعة
M15
H4
دخول متأرجح مع هيكل 4 ساعات
H1
D1
تداول موقفي بناءً على دعم/مقاومة يومي
أي
رسم بياني
الوضع الكلاسيكي — السلوك الأصلي لإطار زمني واحد
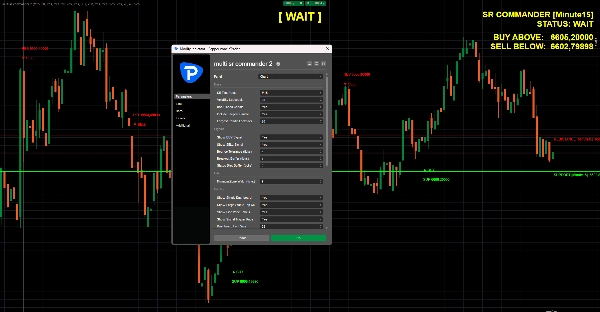
الميزات
- محرك متعدد الأطر الزمنية كامل — أي إطار دعم/مقاومة على أي إطار رسم بياني
- حساب المستويات الموحدة بالتقلبات باستخدام نموذج Yang-Zhang
- شمول أكبر شمعة — يلتقط دائمًا شمعة الهيكل المسيطرة لفترة النظر للخلف
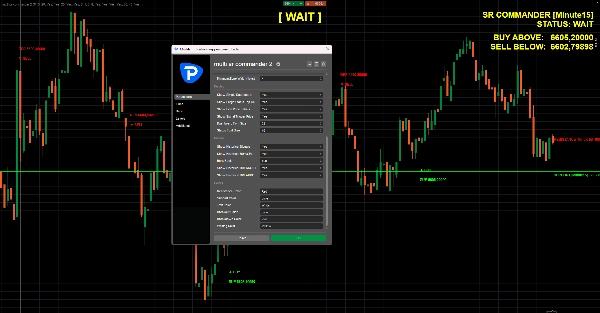
- منطق إشارة الارتداد والرفض مع تحمّل وذاكرة قابلة للتكوين
- كشف الاختراق والانهيار مع ذاكرة قابلة للتعديل
- تراكب الإشارات التاريخية للتحقق الفوري المبني على الرسم البياني
- لوحة تحكم وملصق حالة كبير مع أحجام وألوان خطوط قابلة للتخصيص بالكامل
- عدم إعادة الرسم — جميع الإشارات تعتمد على الشموع المغلقة عندما يكون وضع التأكيد نشطًا
لمن هذا؟
المتداولون الذين يفهمون أن أفضل نقاط الدخول تكون على الأطر الزمنية الأقل، لكن أفضل المستويات تكون على الأطر الزمنية الأعلى. إذا كنت قد رسمت مستويات H4 يدويًا أثناء التداول على M5 — فإن SR Commander يؤتمت هذه العملية بأكملها، ويحافظ عليها من الناحية الرياضية، ويضع الإشارة مباشرة على الرسم البياني الخاص بك في اللحظة التي يتفاعل فيها السعر.
هيكل الإطار الزمني الأعلى. دقة الإطار الزمني الأدنى. مؤشر واحد.
5 | 50 % | |
4 | 50 % | |
3 | 0 % | |
2 | 0 % | |
1 | 0 % |


