
الوصف
فجوات الافتتاح الأسبوعية واليومية — مؤشر NWOG و NDOG
تصور فجوة الافتتاح بمستوى احترافي للمتداولين المؤسسيين والمشاركين الجادين في التداول بالتجزئة
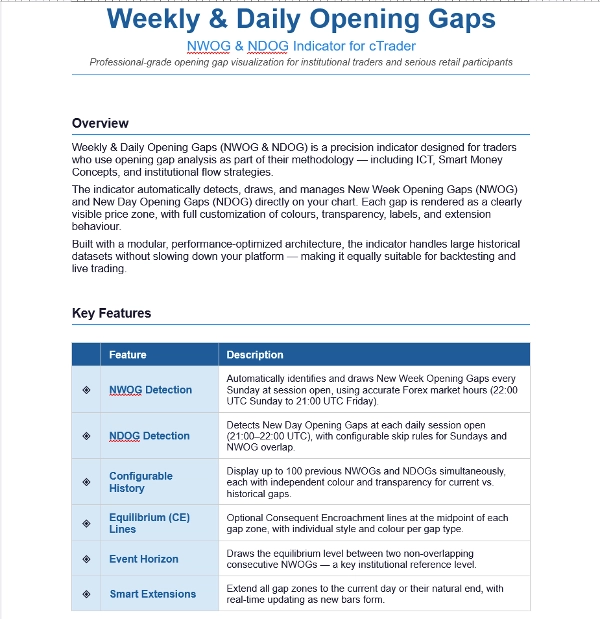
نظرة عامة
فجوات الافتتاح الأسبوعية واليومية (NWOG و NDOG) هو مؤشر دقيق مصمم للمتداولين الذين يستخدمون تحليل فجوة الافتتاح كجزء من منهجيتهم — بما في ذلك ICT، مفاهيم المال الذكي، واستراتيجيات التدفق المؤسسي.
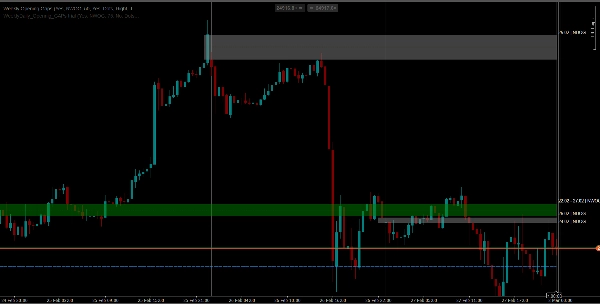
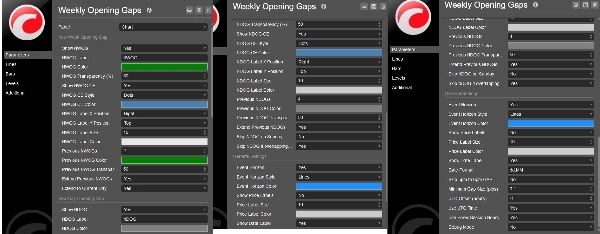
يقوم المؤشر بالكشف التلقائي، والرسم، وإدارة فجوات افتتاح الأسبوع الجديد (NWOG) وفجوات افتتاح اليوم الجديد (NDOG) مباشرة على الرسم البياني الخاص بك. يتم عرض كل فجوة كمنطقة سعرية واضحة، مع تخصيص كامل للألوان، والشفافية، والتسميات، وسلوك الامتداد.
تم بناؤه بهيكل معياري ومحسن للأداء، يتعامل المؤشر مع مجموعات بيانات تاريخية كبيرة دون إبطاء منصتك — مما يجعله مناسبًا بنفس القدر للاختبار الخلفي والتداول المباشر.
الميزات الرئيسية
◈ كشف NWOG
◈ كشف NDOG مع قواعد تخطي قابلة للتكوين لأيام الأحد وتداخل NWOG.
◈ التاريخ القابل للتكوين — عرض حتى 100 NWOG سابق
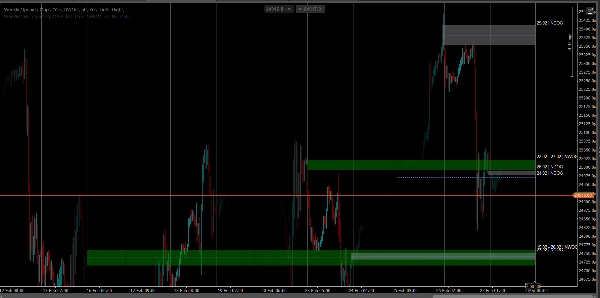
◈ خطوط التوازن (CE)
◈ أفق الحدث — يرسم مستوى التوازن بين اثنين من NWOG المتتالية غير المتداخلة
◈ امتدادات ذكية — تمديد جميع مناطق الفجوة إلى اليوم الحالي أو نهايتها الطبيعية، مع تحديث في الوقت الحقيقي مع تكوين أشرطة جديدة.
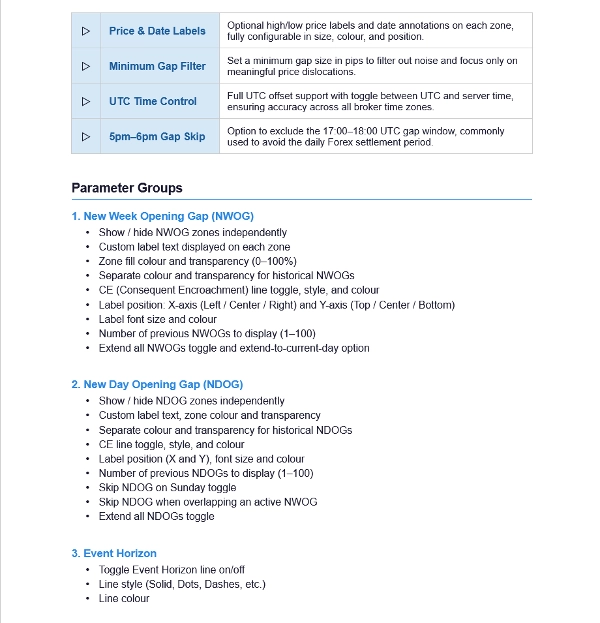
◈ تسميات السعر والتاريخ
◈ فلتر الحد الأدنى للفجوة
◈ التحكم في توقيت UTC
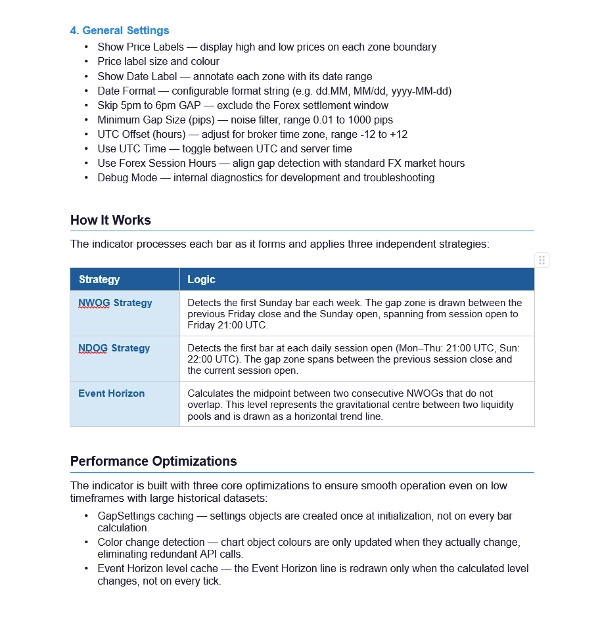
كيف يعمل
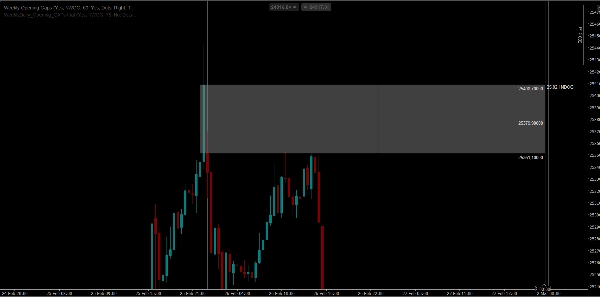
استراتيجية NWOG — يكتشف أول شريط يوم الأحد كل أسبوع. يتم رسم منطقة الفجوة بين إغلاق يوم الجمعة السابق وافتتاح يوم الأحد، وتمتد من افتتاح الجلسة حتى الجمعة الساعة 21:00 بتوقيت UTC.
استراتيجية NDOG — يكتشف أول شريط في كل افتتاح جلسة يومية (الإثنين–الخميس: 21:00 بتوقيت UTC، الأحد: 22:00 بتوقيت UTC). تمتد منطقة الفجوة بين إغلاق الجلسة السابقة وافتتاح الجلسة الحالية.
أفق الحدث — يحسب نقطة المنتصف بين اثنين من NWOG المتتالية التي لا تتداخل. يمثل هذا المستوى مركز الجاذبية بين مجموعتين من السيولة ويرسم كخط اتجاه أفقي.
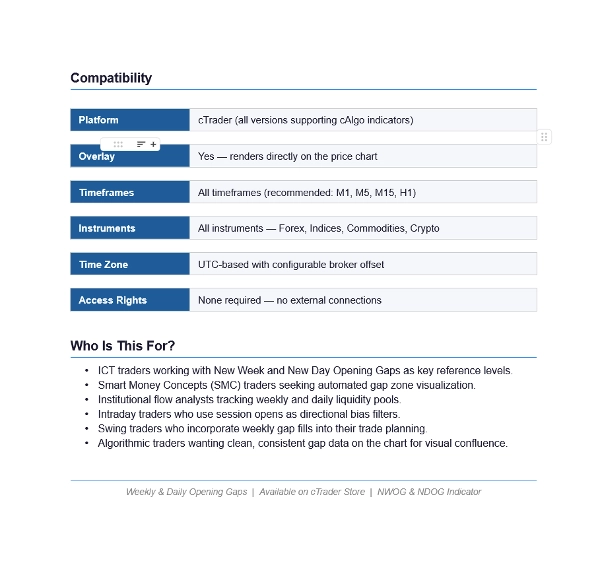
التوافق
المنصة: cTrader (جميع الإصدارات التي تدعم مؤشرات cAlgo)
التراكب: نعم — يعرض مباشرة على مخطط السعر
الأطر الزمنية: جميع الأطر الزمنية (الموصى بها: M1، M5، M15، H1)
الأدوات: جميعها — الفوركس، المؤشرات، السلع، C
لمن هذا؟
متداولو ICT الذين يعملون مع فجوات افتتاح الأسبوع الجديد واليوم الجديد كمستويات مرجعية رئيسية
متداولو مفاهيم المال الذكي (SMC) الباحثون عن تصور تلقائي لمناطق الفجوة
محللو التدفق المؤسسي الذين يتتبعون تجمعات السيولة الأسبوعية واليومية
المتداولون داخل اليوم الذين يستخدمون افتتاح الجلسات كمرشحات لاتجاه التداول
متداولو السوينغ الذين يدمجون ملء الفجوات الأسبوعية في تخطيط تداولهم
المتداولون الخوارزميون الذين يرغبون في بيانات فجوة نظيفة ومتسقة على الرسم البياني للتوافق البصري
الملخص
تقييمات العملاء
5 | 0 % | |
4 | 100 % | |
3 | 0 % | |
2 | 0 % | |
1 | 0 % |


![شعار "[Stellar Strategies] Market Session Ultimate"](https://cdn.ctrader.com/image/webp/61ffd537-0125-4246-9e72-42eca1791d64_28232)


