
الوصف
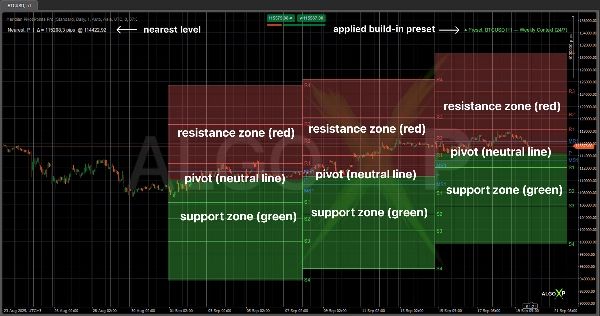
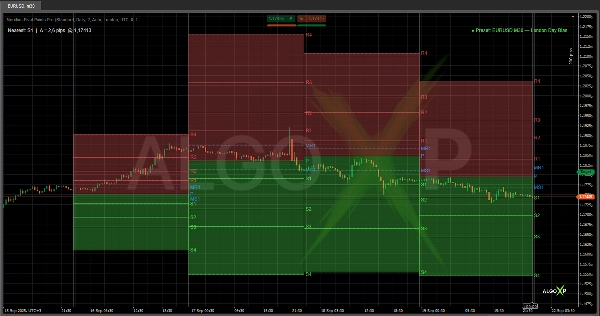
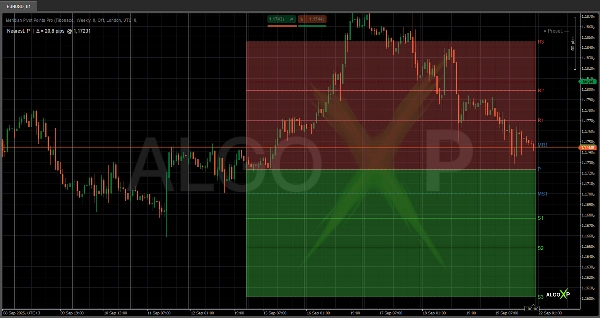
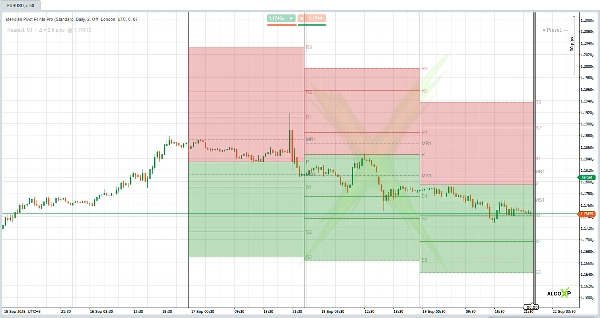
🚀 Meridian Pivot Points Pro هو مؤشر محور متميز لمنصة cTrader يتكيف مع الجلسات و الأطر الزمنية. يرسم مستويات محور احترافية (P, R1–R5, S1–S5) لصيغ Standard وFibonacci وWoodie وCamarilla وDeMark، ويضيف مستويات وسطى، ويسلط الضوء على مناطق (أخضر تحت P، أحمر فوق P) مع شفافية قابلة للتعديل.
تقوم الإعدادات المسبقة التلقائية المدمجة بضبط الإعدادات فورًا للرموز والأطر الزمنية الشائعة. تعرض واجهة العرض أقرب مستوى (مع المسافة بالنقاط) و اسم الإعداد المسبق النشط عند التطابق. تنبه التنبيهات الذكية عند عبور المستوى أو القرب — مع تحكمات صوتية مستقلة.
يعمل مباشرةً مع الفوركس، المؤشرات، الذهب، النفط، والعملات المشفرة عبر التداول اليومي والمتأرجح.
استكشف المزيد من الموارد والأسئلة الشائعة المفصلة على AlgoXP
🔥 لماذا يختار المتداولون Meridian
- مدرك للجلسات: استخدم محاور يومية/أسبوعية/شهرية أو وضع الجلسة مع إعدادات مسبقة جاهزة (طوكيو، لندن، نيويورك، التداخل، إلخ) وتعويض UTC/الوسيط/مخصص.
- الإعدادات المسبقة التلقائية (جديدة): عند التمكين، يقوم المؤشر بتطبيق تلقائي لإعداد منسق للرموز + الأطر الزمنية المعروفة ويعرض اسم الإعداد المسبق في واجهة العرض.
- وضوح بالتصميم: مستويات وسطى، تسميات، سمات نظيفة، وأشرطة نصف شفافة (الأخضر للدعم، الأحمر للمقاومات، الأزرق للمحور).
- تنبيهات قابلة للتنفيذ: عبور عند إغلاق الشمعة والقرب بالنقاط، كل منها مع تبديل صوتي خاص به.
- خفيف الوزن وقابل للقراءة: مُحسّن لرسم الفترات الحالية و(اختياريًا) التاريخية مع طباعة واضحة.
🧭 كيفية الاستخدام
- الاتجاه: فوق P = ميل صاعد؛ تحت P = ميل هابط.
- العمل داخل المناطق: في الأخضر، انظر إلى الشراء نحو P → R1؛ في الأحمر، انظر إلى البيع نحو P → S1.
- المستويات الوسطى: MR1/MS1 هي نقاط ارتداد/اختبار نظيفة داخل P–R1 و S1–P.
- الاختراق والإغلاق: إغلاق فوق R1 → الهدف R2 (ثم R3…); إغلاق تحت S1 → الهدف S2 (ثم S3…).
- وضع الجلسة: تداول داخل نافذتك النشطة (مثلاً، لندن أو تداخل لندن-نيويورك) لمسات أنظف ومتابعة.
🤖 الإعدادات المسبقة المدمجة
EURUSD M30, GBPUSD M15, USDJPY M5, XAUUSD M15, XAUUSD H1, US100 M5, USOIL M15, DAX40 M5, BTCUSD H1, ETHUSD H1, EURUSD H1, GBPJPY M15.
الملخص
Key features include session modes with presets for major trading sessions (Tokyo, London, New York, and overlaps), automatic presets that optimize settings for popular symbols and timeframes, and a heads-up display (HUD) showing the nearest pivot level and active preset. Smart alerts notify users on pivot level crosses or proximity, each with independent sound controls.
Meridian Pivot Points Pro supports multiple markets such as Forex, indices, gold, oil, and cryptocurrencies, suitable for intraday and swing trading. It emphasizes clarity with clean labels, semi-transparent bands, and optimized drawing for current and historical periods. Built-in presets cover common symbol and timeframe combinations like EURUSD M30, GBPUSD M15, XAUUSD H1, BTCUSD H1, and others, facilitating quick setup and use.
تقييمات العملاء
5 | 100 % | |
4 | 0 % | |
3 | 0 % | |
2 | 0 % | |
1 | 0 % |


