
Descripción
Signal Strike es un indicador de trading profesional diseñado para ctrader que ofrece señales de entrada claras y de alta confianza directamente en tu gráfico. Construido con una lógica avanzada que combina tendencia, momentum, volatilidad y confirmación de volumen, esta herramienta ayuda a los traders a identificar oportunidades precisas de COMPRA y VENTA con confianza.
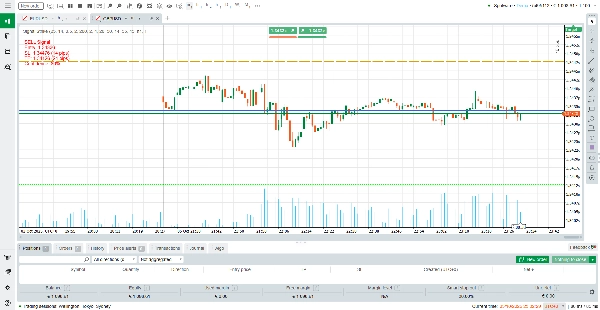
A diferencia de los indicadores genéricos, Signal Strike está diseñado para filtrar velas de indecisión y configuraciones débiles. Cuando las condiciones se alinean, el indicador traza niveles de entrada, stop loss y take profit directamente en el gráfico, junto con un porcentaje de confianza. Si no se detecta ninguna configuración válida, el indicador mostrará “No valid BUY/SELL signal” en la parte superior del gráfico, para que siempre sepas exactamente cuándo actuar y cuándo abstenerte.
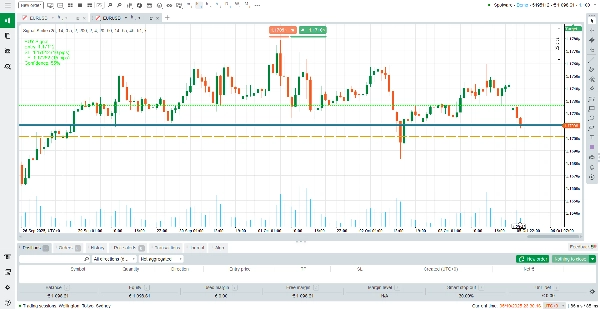
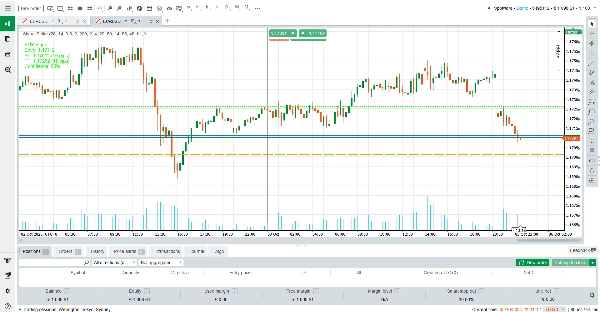
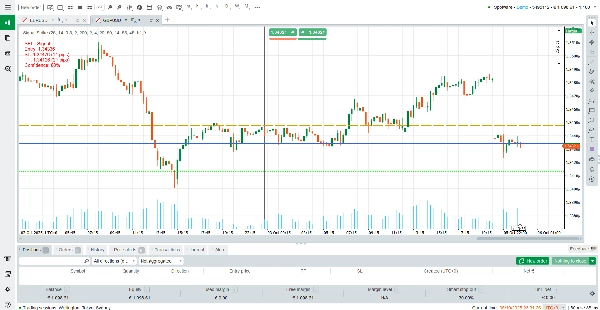
En Signal Strike, cada color de línea tiene un significado claro para ayudar a los traders a leer el gráfico al instante. La Línea de Entrada se dibuja en azul, marcando el precio exacto donde se activa la configuración de la operación. La Línea de Stop Loss aparece en naranja, mostrando el nivel protector donde la operación se cerrará si el mercado se mueve en contra.
La Línea de Take Profit se muestra en verde lima, destacando el nivel objetivo donde se aseguran las ganancias. Para mayor claridad direccional, las señales de COMPRA se enfatizan en verde, mientras que las señales de VENTA se resaltan en rojo. Estos colores fuertes y saturados aseguran que cada elemento destaque, facilitando distinguir entre zonas de entrada, riesgo y recompensa de un vistazo.
Cómo Leer las Señales
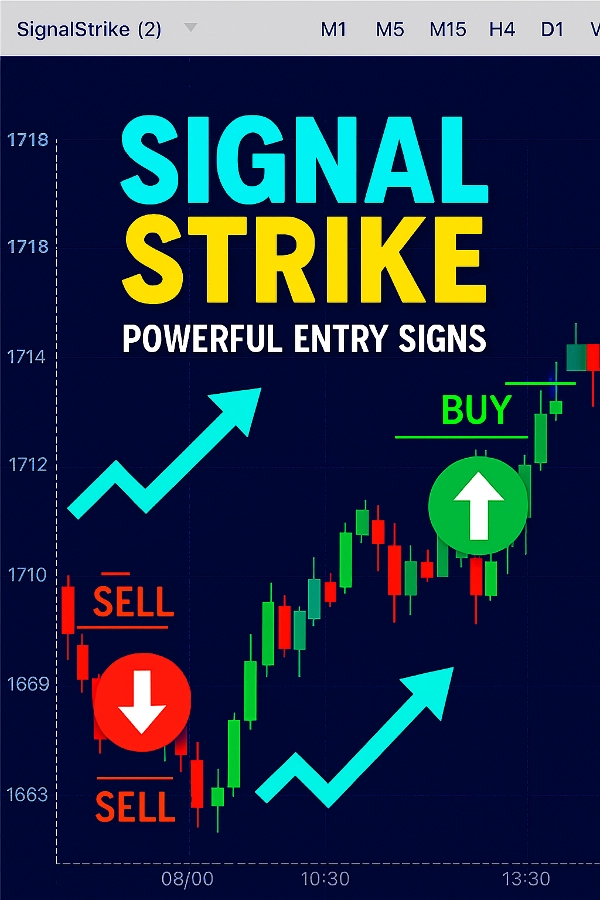
Señal de COMPRA: Aparece una flecha verde hacia arriba y una etiqueta que muestra el precio de entrada, stop loss, take profit y nivel de confianza.
Señal de VENTA: Aparece una flecha roja hacia abajo y una etiqueta con los mismos detalles.
Sin Señal: Si las condiciones del mercado no son lo suficientemente fuertes, el indicador escribe “No valid BUY/SELL signal” en la parte superior del gráfico.
TP/SL Dinámicos: Los niveles de take profit y stop loss se ajustan automáticamente según la volatilidad y las condiciones del RSI.
Para maximizar resultados, se recomienda alternar entre marcos temporales (M1, M5, M15, H1, H4) para encontrar las señales más claras según tu estilo de trading.
Cómo Funciona el Indicador
Signal Strike combina múltiples capas de análisis:
Detección de Tendencia.
Filtro de Momentum.
Chequeo de Volatilidad.
Confirmación de Volumen.
Filtro de Indecisión – Se ignoran velas pequeñas y débiles para evitar entradas falsas.
Solo cuando estas condiciones se alinean, el indicador genera una señal de COMPRA o VENTA. Esto asegura que cada señal esté respaldada por múltiples confirmaciones, reduciendo el ruido y mejorando la precisión.
Características Clave (5 Destacados)
Niveles Claros de Entrada, SL y TP – Visibles instantáneamente en el gráfico.
Porcentaje de Confianza – Conoce la fuerza de cada señal antes de entrar.
Soporte Multi‑Marco Temporal – Funciona en todos los marcos temporales desde M1 hasta H4.
Filtrado Automático – Evita señales falsas durante períodos de indecisión o bajo volumen.
Etiquetas Amigables – Fácil de leer, con “No Signal” mostrado cuando no se cumplen las condiciones.
Configuraciones Recomendadas por Marco Temporal
El indicador incluye entradas flexibles (LookbackCandles, ATRPeriod, ATRMultiplier, períodos SMA, niveles RSI, etc.). A continuación, configuraciones optimizadas para diferentes estilos de trading:
M1 (Scalping)
LookbackCandles: 20
ATRPeriod: 10
ATRMultiplier: 0.4
SMA Rápido/Lento: 10 / 30
RSI: 12 (Compra > 55, Venta < 45) → Mejor para scalps ultra cortos con entradas rápidas.
M5 (Intradiario Rápido)
LookbackCandles: 25
ATRPeriod: 14
ATRMultiplier: 0.5
SMA Rápido/Lento: 20 / 50
RSI: 14 (Compra > 55, Venta < 45) → Equilibrado para operaciones intradiarias cortas.
M15 (Swing Intradiario)
LookbackCandles: 30
ATRPeriod: 14
ATRMultiplier: 0.6
SMA Rápido/Lento: 20 / 60
RSI: 14 (Compra > 56, Venta < 44) → Ideal para capturar movimientos intradiarios medianos.
H1 (Swing Trading)
LookbackCandles: 40
ATRPeriod: 20
ATRMultiplier: 0.7
SMA Rápido/Lento: 30 / 80
RSI: 14 (Compra > 57, Venta < 43) → Filtros más fuertes para swings en marcos temporales mayores.
H4 (Trading de Posición)
LookbackCandles: 50
ATRPeriod: 20
ATRMultiplier: 0.8
SMA Rápido/Lento: 50 / 100
RSI: 14 (Compra > 58, Venta < 42) → Mejor para entradas a largo plazo y alta confianza.
¿Por Qué Elegir Signal Strike?
Signal Strike no es solo otro indicador, es una herramienta para la toma de decisiones que ahorra tiempo, reduce la incertidumbre y ayuda a los traders a enfocarse en las mejores oportunidades. Ya seas un scalper en M1 o un swing trader en H4, Signal Strike se adapta a tu estilo y proporciona señales de entrada potentes con claridad y precisión.
Toma el control de tu trading con Signal Strike y experimenta la diferencia de operar con confianza.
Resumen
When a valid trade setup occurs, Signal Strike plots entry, stop loss, and take profit levels on the chart, each color-coded for clarity: blue for entry, orange for stop loss, and lime green for take profit. BUY signals are marked with green arrows and labels, while SELL signals use red. A confidence percentage accompanies each signal to indicate its strength. If no valid setup is detected, a “No valid BUY/SELL signal” message appears.
The indicator supports multiple timeframes from M1 to H4, with recommended settings optimized for scalping, intraday, swing, and position trading styles. Take profit and stop loss levels adjust dynamically based on volatility and RSI conditions. Signal Strike aims to assist traders in making informed decisions by highlighting clear entry points, risk levels, and profit targets across various markets including Forex, commodities, crypto, and stocks.
Valoraciones de clientes
5 | 50 % | |
4 | 0 % | |
3 | 50 % | |
2 | 0 % | |
1 | 0 % |


![Logotipo de "[CB] Pivot Points Pro"](https://cdn.ctrader.com/image/webp/43463c82-67b0-4f10-a4ba-901bba091d81_32594)


