
Daily Open Color Zones
Indicador
345 descargas
Versión 1.0, Sep 2025
Windows, Mac
4.0
Valoraciones: 1
Descripción
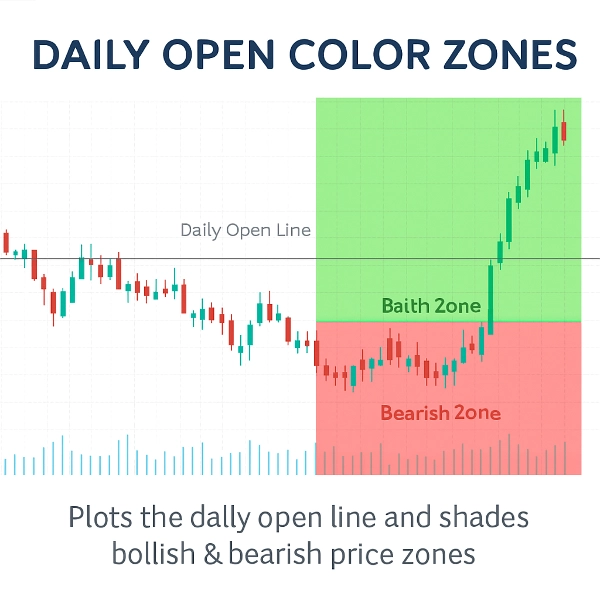
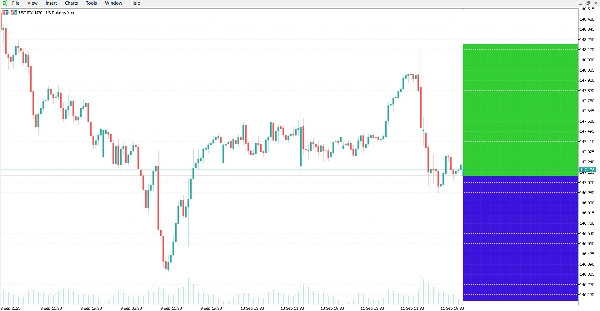
Este indicador traza la Línea de Apertura Diaria y sombrear las zonas de precio alcistas y bajistas a su alrededor.
Proporciona una referencia visual clara para ver si el mercado está operando por encima o por debajo de la apertura diaria, que es un nivel comúnmente utilizado en el análisis intradía.
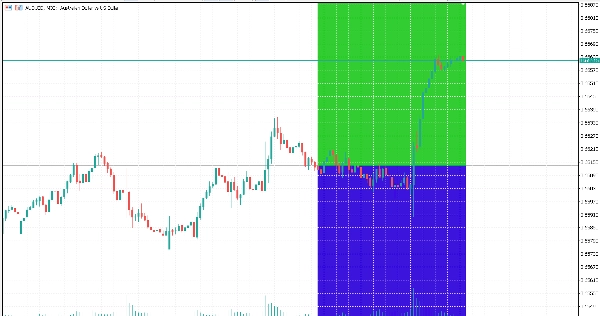
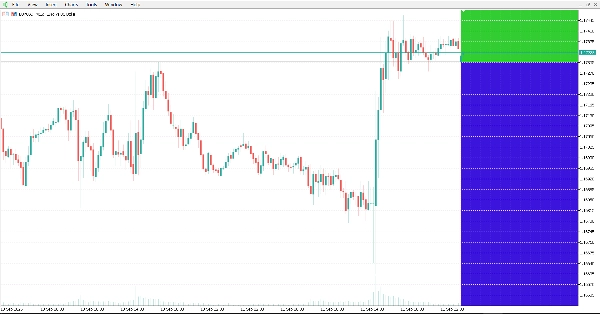
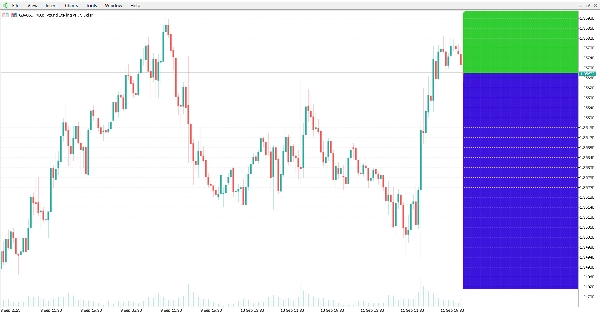
El indicador dibuja automáticamente una línea horizontal en el precio de apertura diaria y resalta las áreas del gráfico:
- Zona verde por encima de la línea (área alcista).
- Zona roja por debajo de la línea (área bajista).
Características:
- Línea de Apertura Diaria Automática: trazado preciso del precio de apertura diaria.
- Zonas de Color: distingue fácilmente las áreas alcistas y bajistas con colores personalizables.
- Actualizaciones Dinámicas: las zonas se ajustan automáticamente con cada nueva vela.
- Apariencia personalizable: se pueden modificar el estilo de línea, grosor y colores de las zonas.
- Ligero y eficiente: diseñado para un uso mínimo de CPU.
- Funciona en todos los símbolos y marcos temporales.
Conclusión:
El indicador ofrece una visualización clara en el gráfico de la apertura diaria y las zonas alcistas/bajistas relacionadas. Puede aplicarse a diferentes mercados y marcos temporales para análisis técnico.
Resumen
Resumen de IA
The Daily Open Color Zones indicator visually marks the daily open price on trading charts by automatically plotting a horizontal line at this level. It shades the price area above the daily open line in green to indicate bullish zones and the area below in red to indicate bearish zones. These color-coded zones update dynamically with each new candle, providing real-time visual cues about market direction relative to the daily open. The indicator supports all symbols and timeframes, making it applicable across various markets including Forex, cryptocurrencies, and commodities like gold (XAUUSD). Users can customize the line style, thickness, and zone colors to suit their preferences. Designed to be lightweight, it minimizes CPU usage while offering clear intraday reference points commonly used in technical analysis and scalping strategies.
Perfil del indicador
Valoraciones de clientes
4.0
Valoraciones: 1
5 | 0 % | |
4 | 100 % | |
3 | 0 % | |
2 | 0 % | |
1 | 0 % |
Valoraciones de clientes
October 20, 2025
Clean and visual 🎨 - Daily Open Zones make trend bias crystal clear. Great tool for intraday planning and momentum entries!
Conversación
Preguntas frecuentes
Forex
Scalping
EURUSD
Crypto
Grid
XAUUSD
Los productos disponibles a través de cTrader Store, incluidos bots, indicadores y plugins para operar, son proporcionados por desarrolladores de terceros y están disponibles únicamente con fines informativos y de acceso técnico. cTrader Store no es un bróker, por lo que no proporciona asesoramiento de inversión, recomendaciones personales ni ninguna garantía de rentabilidad futura.


![Logotipo de "[Stellar Strategies] Market Session Ultimate"](https://cdn.ctrader.com/image/webp/61ffd537-0125-4246-9e72-42eca1791d64_28232)


Precio
Desde 13/09/2025
27
Ventas
5.38K
Instalaciones gratis