
Descripción
La Guía Completa para el Análisis con la Nube Ichimoku
Historia y Antecedentes
El Ichimoku Kinko Hyo (o Nube Ichimoku) fue desarrollado por el periodista japonés Goichi Hosoda a finales de la década de 1930. Después de años de investigación y pruebas retrospectivas con un equipo de asistentes, Hosoda publicó sus hallazgos en 1969. El nombre "Ichimoku Kinko Hyo" se traduce como "gráfico de equilibrio de un vistazo", lo que refleja su propósito: permitir a los traders evaluar rápidamente múltiples aspectos de la acción del mercado en una sola vista.
La innovación de Hosoda fue notable ya que creó este sistema complejo décadas antes de que el análisis por computadora estuviera disponible, realizando todos los cálculos a mano. Lo que hace único al sistema Ichimoku es su enfoque holístico, integrando múltiples marcos temporales y dimensiones del análisis de mercado en un marco unificado.
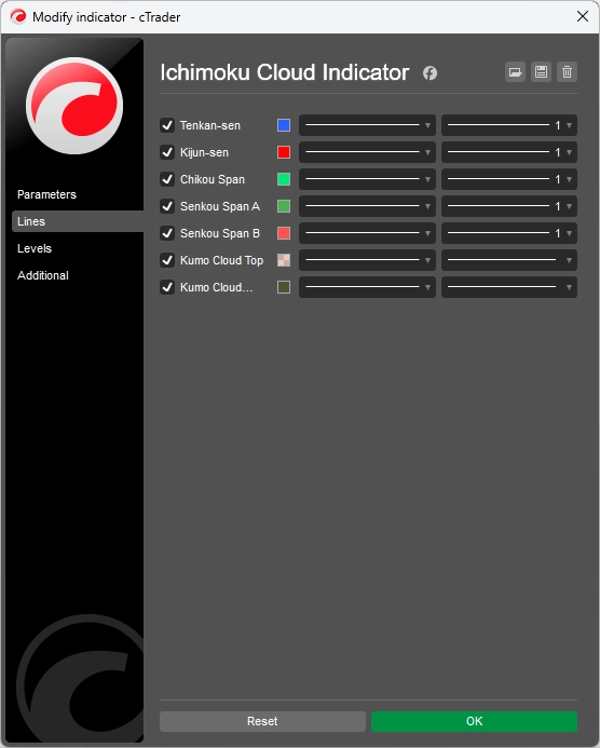
Los Cinco Componentes de la Nube Ichimoku
La Nube Ichimoku consta de cinco líneas distintas, cada una proporcionando perspectivas específicas:
1. Tenkan-sen (Línea de Conversión)
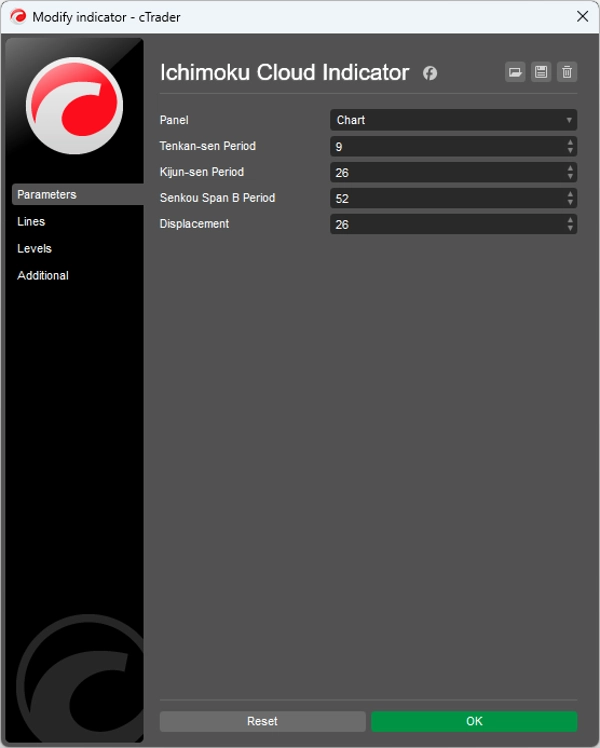
- Cálculo: (Máximo más alto + Mínimo más bajo) / 2 para los últimos 9 períodos
- Función: Representa el impulso del mercado a corto plazo
- Interpretación: Actúa como un nivel dinámico de soporte/resistencia e indicador de tendencia
2. Kijun-sen (Línea Base)
- Cálculo: (Máximo más alto + Mínimo más bajo) / 2 para los últimos 26 períodos
- Función: Representa el impulso del mercado a medio plazo
- Interpretación: Actúa como un nivel más fuerte de soporte/resistencia y puede servir como un stop dinámico
3. Senkou Span A (Span Líder A)
- Cálculo: (Tenkan-sen + Kijun-sen) / 2, trazado 26 períodos hacia adelante
- Función: Forma el borde delantero de la nube (Kumo)
- Interpretación: Nivel proyectado de soporte/resistencia
4. Senkou Span B (Span Líder B)
- Cálculo: (Máximo más alto + Mínimo más bajo) / 2 para los últimos 52 períodos, trazado 26 períodos hacia adelante
- Función: Forma el borde trasero de la nube (Kumo)
- Interpretación: Nivel proyectado de soporte/resistencia
5. Chikou Span (Span Rezagado)
- Cálculo: Precio de cierre actual, trazado 26 períodos hacia atrás
- Función: Confirma tendencias e identifica posibles reversiones
- Interpretación: Cuando está por encima de la acción del precio, es alcista; cuando está por debajo, es bajista
El Kumo (Nube)
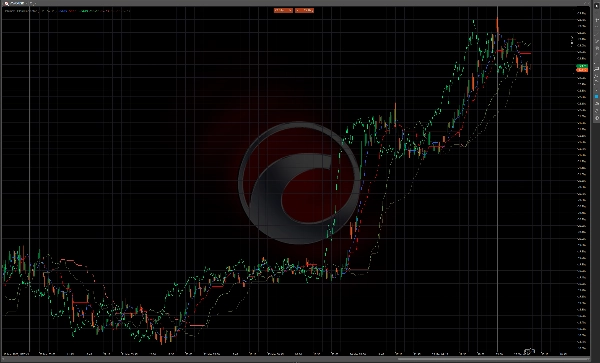
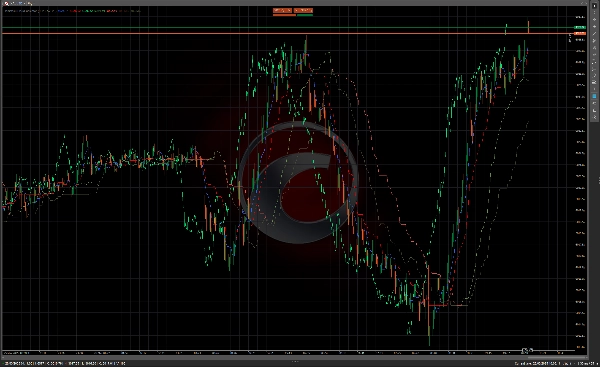
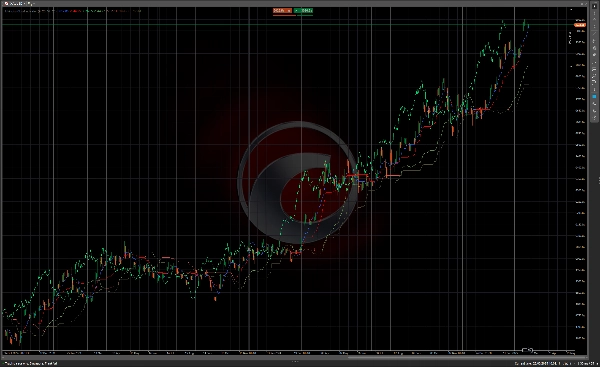
El área entre Senkou Span A y Senkou Span B se llama "Kumo" o nube. La nube representa zonas potenciales de soporte y resistencia y su grosor indica la volatilidad del mercado y la fuerza de estas zonas.
- Nube Gruesa: Soporte/resistencia fuerte, mayor volatilidad
- Nube Delgada: Soporte/resistencia más débil, menor volatilidad
- Nube Alcista: Senkou Span A por encima de Senkou Span B (a menudo coloreada de verde)
- Nube Bajista: Senkou Span B por encima de Senkou Span A (a menudo coloreada de rojo)
Reglas y Señales de Trading
Determinación de Tendencia
- Criterios para Tendencia Alcista:
-
- El precio está por encima de la nube
- Tenkan-sen está por encima de Kijun-sen
- Chikou Span está por encima del precio de hace 26 períodos
- Senkou Span A está subiendo y por encima de Senkou Span B (nube alcista)
- Criterios para Tendencia Bajista:
-
- El precio está por debajo de la nube
- Tenkan-sen está por debajo de Kijun-sen
- Chikou Span está por debajo del precio de hace 26 períodos
- Senkou Span A está bajando y por debajo de Senkou Span B (nube bajista)
- Mercado Neutral/En Rango:
-
- El precio está dentro de la nube
- Tenkan-sen y Kijun-sen están planos o cruzándose frecuentemente
Señales de Entrada
Señales de Entrada Alcistas
- Cruce TK (Cruce Tenkan/Kijun):
-
- Tenkan-sen cruza por encima de Kijun-sen
- Más efectivo cuando el precio está por encima de la nube
- Señal más fuerte cuando la nube es alcista
- Ruptura del Kumo:
-
- El precio rompe por encima de la nube después de estar por debajo o dentro de ella
- Señal más fuerte cuando la nube adelante es alcista (Senkou Span A > Senkou Span B)
- Confirmación del Chikou Span:
-
- Chikou Span cruza por encima del precio de hace 26 períodos
- No hay resistencia adelante para el Chikou Span
Señales de Entrada Bajistas
- Cruce TK (Bajista):
-
- Tenkan-sen cruza por debajo de Kijun-sen
- Más efectivo cuando el precio está por debajo de la nube
- Señal más fuerte cuando la nube es bajista
- Ruptura del Kumo (Bajista):
-
- El precio rompe por debajo de la nube después de estar por encima o dentro de ella
- Señal más fuerte cuando la nube adelante es bajista (Senkou Span B > Senkou Span A)
- Confirmación del Chikou Span (Bajista):
-
- Chikou Span cruza por debajo del precio de hace 26 períodos
- No hay soporte adelante para el Chikou Span
Señales de Salida
- Reversión de Tendencia: Cuando comienzan a aparecer los criterios para la tendencia opuesta
- Cruce TK: Cuando Tenkan-sen cruza Kijun-sen en la dirección opuesta
- Toque de la Nube: Cuando el precio toca el lado opuesto de la nube
- Advertencia del Chikou Span: Cuando el Chikou Span se acerca a niveles históricos de precio
Niveles de Soporte y Resistencia
- Soporte/Resistencia Inmediata: Tenkan-sen y Kijun-sen
- Soporte/Resistencia a Medio Plazo: La nube (más fuerte en secciones planas)
- Giro del Kumo: Cuando Senkou Span A y B se cruzan, creando puntos potenciales de reversión
Técnicas Avanzadas de Ichimoku
1. Giro del Kumo (Giro de la Nube)
Un Giro del Kumo ocurre cuando Senkou Span A y B se cruzan, creando un punto potencial de reversión 26 períodos en el futuro. Los traders a menudo usan esto como una señal de advertencia temprana para posibles cambios de tendencia.
2. Análisis de Marcos Temporales
Muchos traders de Ichimoku analizan múltiples marcos temporales:
- Marco temporal superior para la dirección general de la tendencia
- Marco temporal medio para señales de entrada
- Marco temporal inferior para la sincronización precisa de la entrada
3. Ensanchamiento/Estrechamiento de Senkou Span
- Nube Ensanchándose: Aumento de la volatilidad del mercado, tendencia más fuerte
- Nube Estrechándose: Disminución de la volatilidad, posible debilitamiento de la tendencia
4. Kumo Plano (Nube Plana)
Cuando ambos Senkou Spans corren paralelos, a menudo indica una tendencia fuerte con niveles claros de soporte/resistencia.
Aplicaciones Prácticas
Condiciones de Mercado Ideales
La Nube Ichimoku funciona mejor en mercados con tendencia y en todos los marcos temporales. Puede aplicarse a:
- Forex
- Acciones
- Materias primas
- Criptomonedas
- Índices
Gestión de Riesgos
- Usar la nube como un nivel dinámico de stop-loss
- Ajustar el tamaño de la posición según el grosor de la nube (nube más gruesa = mayor volatilidad)
- Considerar Kijun-sen como un stop dinámico en tendencias fuertes
Compatibilidad de Marcos Temporales
Los ajustes tradicionales (9, 26, 52) se basaron en la semana de trading japonesa (que tenía 6 días), por lo que algunos traders ajustan estos parámetros:
- 10, 30, 60 para gráficos diarios
- 20, 60, 120 para señales más conservadoras
- 7, 22, 44 para mercados occidentales (semana de trading de 5 días)
Conclusión
La Nube Ichimoku ofrece un sistema de trading completo que proporciona múltiples capas de información del mercado en una sola vista. Lo que lo hace poderoso no son solo las señales individuales, sino la confluencia de múltiples indicadores trabajando juntos. Cuando todos los componentes se alinean, el sistema Ichimoku puede ofrecer oportunidades de trading de alta probabilidad con parámetros de riesgo claramente definidos.
Aunque inicialmente parece complejo, con práctica, los traders pueden evaluar las condiciones del mercado "de un vistazo" como Hosoda pretendía. Los componentes con desplazamiento temporal del sistema también proporcionan una perspectiva única sobre la dinámica del mercado, permitiendo a los traders ver niveles potenciales futuros de soporte y resistencia antes de que se vuelvan relevantes.
Resumen
1. Tenkan-sen (Conversion Line): short-term momentum indicator and dynamic support/resistance.
2. Kijun-sen (Base Line): medium-term momentum indicator and stronger support/resistance, also used as a trailing stop.
3. Senkou Span A (Leading Span A): forms the leading edge of the cloud (Kumo), projected 26 periods ahead.
4. Senkou Span B (Leading Span B): forms the trailing edge of the cloud, projected 26 periods ahead.
5. Chikou Span (Lagging Span): current closing price plotted 26 periods back, confirming trends and potential reversals.
The cloud (Kumo), formed between Senkou Span A and B, represents support and resistance zones, with thickness indicating volatility and strength. The indicator provides trend determination, entry and exit signals, and support/resistance levels. It is applicable across various markets including Forex, stocks, commodities, cryptocurrencies, and indices, and works best in trending markets and multiple time frames. Risk management features include dynamic stop-loss levels based on the cloud and position sizing adjustments according to cloud thickness. Traditional settings are (9, 26, 52) periods, with common adjustments for different trading weeks.


![Logotipo de "[CB] Pivot Points Pro"](https://cdn.ctrader.com/image/webp/43463c82-67b0-4f10-a4ba-901bba091d81_32594)


![Logotipo de "[Stellar Strategies] Wave Trend Pro"](https://cdn.ctrader.com/image/webp/5f226fbb-245a-41cd-9cdd-b018257d5e6d_28617)


