
Chaikin Money Flow
Indicador
130 descargas
Versión 1.0, Dec 2024
Windows, Mac
5.0
Valoraciones: 1
Descripción
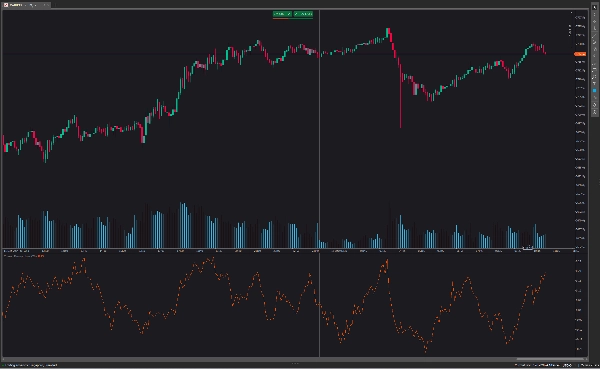
El propósito principal del flujo de dinero de Chaikin es distinguir entre períodos de acumulación y distribución de un valor. Cuando el indicador está por encima de la línea cero, indica que el valor está experimentando una acumulación neta, lo que sugiere que los inversores están comprando el activo.
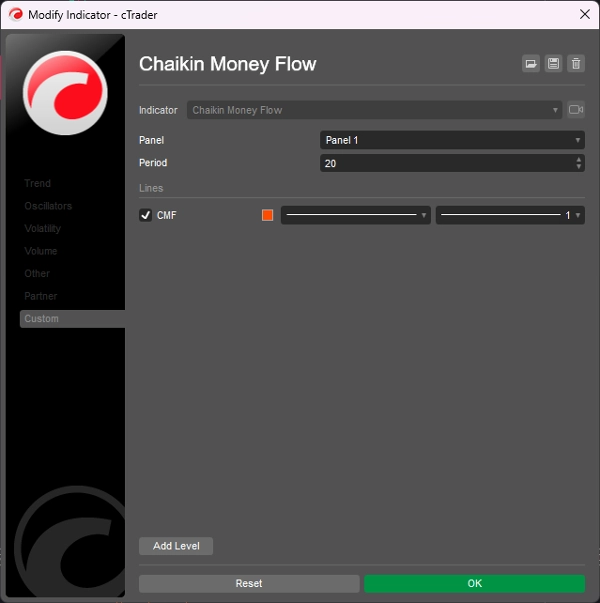
- Los ajustes del Flujo de Dinero de Chaikin con valores superiores a 30 hacen que el indicador sea menos sensible. Esto resultará en señales menos frecuentes, pero de mejor calidad.
- Los ajustes del Flujo de Dinero de Chaikin con valores inferiores a 20 hacen que el indicador sea demasiado sensible. Esto resultará en más ruido de mercado.
- Indica una tendencia alcista continua cuando el indicador CMF cruza la línea cero desde arriba y genera señales de compra/largo.
- Indica una tendencia bajista continua cuando el indicador CMF cruza la línea cero desde abajo y genera señales de venta/corto.
Resumen
Resumen de IA
The Chaikin Money Flow (CMF) indicator is designed to identify periods of accumulation and distribution for a security. When the CMF value is above zero, it signals net accumulation, indicating buying pressure. Conversely, values below zero suggest distribution or selling pressure. The indicator’s sensitivity can be adjusted: settings above 30 reduce sensitivity, producing fewer but higher-quality signals, while settings below 20 increase sensitivity, resulting in more market noise. Key signals include a continued uptrend when the CMF crosses the zero line from above, generating buy signals, and a continued downtrend when it crosses from below, generating sell signals. This tool helps traders assess buying and selling momentum to inform trading decisions.
Perfil del indicador
Valoraciones de clientes
5.0
Valoraciones: 1
5 | 100 % | |
4 | 0 % | |
3 | 0 % | |
2 | 0 % | |
1 | 0 % |
Valoraciones de clientes
August 18, 2025
Reliable volume-based trend confirmation, easy to read, customizable period. Cons: No alerts, no MTF analysis, limited filtering options.
Conversación
Preguntas frecuentes
Los productos disponibles a través de cTrader Store, incluidos bots, indicadores y plugins para operar, son proporcionados por desarrolladores de terceros y están disponibles únicamente con fines informativos y de acceso técnico. cTrader Store no es un bróker, por lo que no proporciona asesoramiento de inversión, recomendaciones personales ni ninguna garantía de rentabilidad futura.
Más de este autor


![Logotipo de "[Stellar Strategies] Smart ADX"](https://cdn.ctrader.com/image/webp/af13b084-b6f6-41db-b7bc-c7e688b57b05_36929)


Precio
2
Ventas
6.9K
Instalaciones gratis