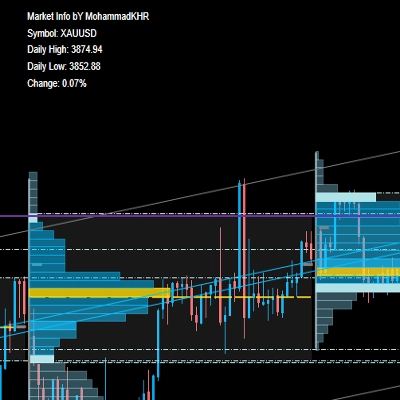
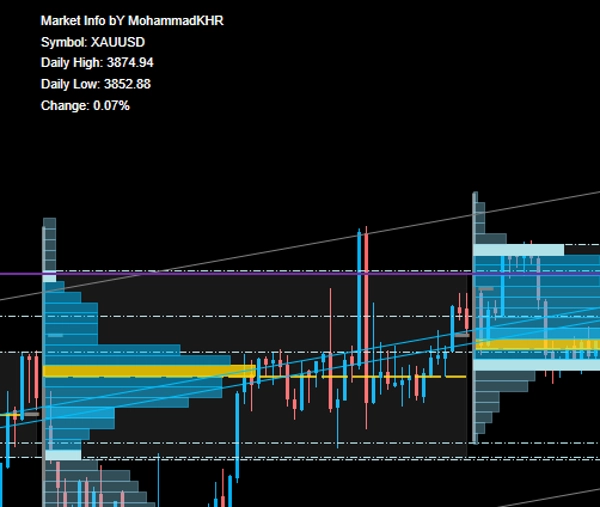
Market Info bY MohammadKHR
Gösterge
217 i̇ndirmeler
Sürüm 1.0, Sep 2025
Windows, Mac
Açıklama
- Günlük En Yüksek ve En Düşük: Herhangi bir enstrümanın gün içindeki en yüksek ve en düşük fiyatlarını anında görüntüleyin.
- Canlı Yüzde Değişimi: Piyasa momentumunu hızlıca değerlendirebilmeniz için gerçek zamanlı fiyat değişimini yüzde olarak takip edin.
- Kullanıcı Dostu Görünüm: Hem yeni başlayanlar hem de deneyimli yatırımcılar için temiz ve minimalist arayüz.
- Ücretsiz Kullanım
Özet
YZ özeti
Market Info by MohammadKHR is a trading indicator that provides real-time daily high and low prices for any financial instrument. It features a live percentage change display, allowing users to monitor price movements and market momentum instantly. The indicator supports various markets and symbols including Forex (e.g., EURUSD, GBPUSD, USDJPY, NZDUSD), cryptocurrencies (e.g., BTCUSD), commodities (e.g., XAUUSD), indices (e.g., NAS100), and stocks. Its user interface is designed to be clean and minimalistic, suitable for both beginners and experienced traders. This tool helps traders quickly assess daily price extremes and percentage changes to inform trading decisions.
Gösterge profili
Müşteri değerlendirmeleri
0.0
Değerlendirmeler: 0
Müşteri değerlendirmeleri
Bu ürün için henüz bir değerlendirme yok. Ürünü denediniz mi? O zaman ona dair görüşlerini paylaşan ilk kişi olun!
Tartışma
SSS
BTCUSD
Forex
Signal
Indices
EURUSD
Commodities
GBPUSD
NZDUSD
Prop
Crypto
Stocks
XAUUSD
NAS100
USDJPY
cTrader Store üzerinden erişilebilen işlem botları, göstergeler ve eklentiler gibi ürünler, üçüncü taraf sağlayıcılar tarafından sağlanır ve yalnızca bilgilendirme ve teknik erişim amaçlarıyla sunulur. cTrader Store bir broker değildir ve yatırım tavsiyesi, kişisel öneriler vermez veya gelecekteki performansı garanti etmez.


Fiyat
2
Satışlar
217
Ücretsiz yüklemeler