
Penerangan
Teori Kotak Darvas
Teori Kotak Darvas adalah teknik perdagangan yang dibangunkan oleh Nicolas Darvas pada tahun 1950-an. Ia adalah strategi perdagangan berasaskan momentum yang menggunakan tindakan harga untuk mengenal pasti titik kemasukan dan keluar yang berpotensi dalam pasaran.
Bagaimana Kotak Darvas Berfungsi
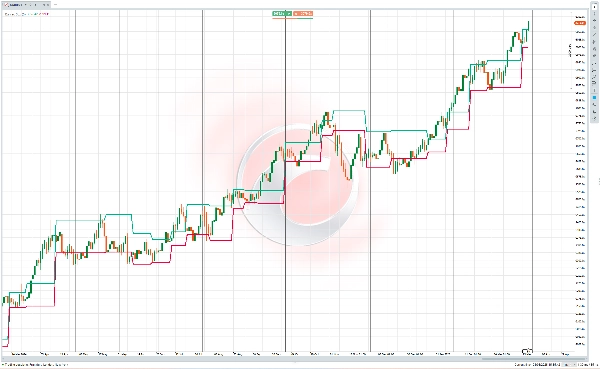
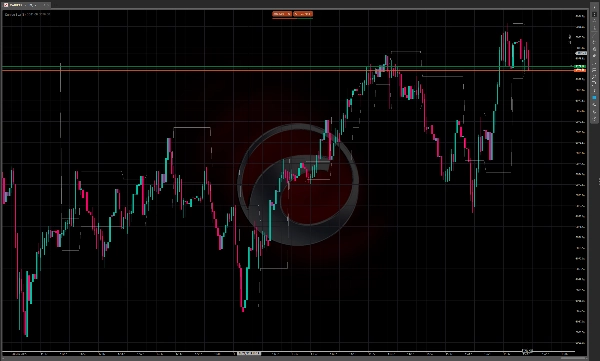
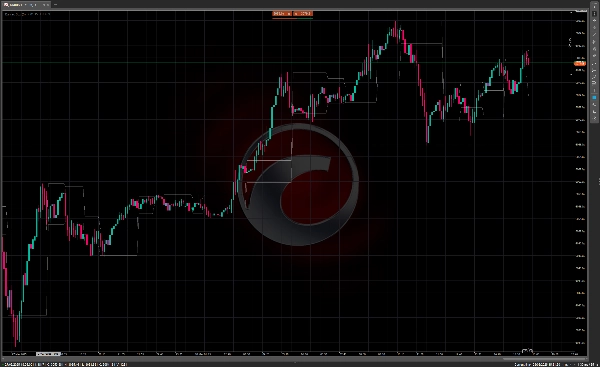
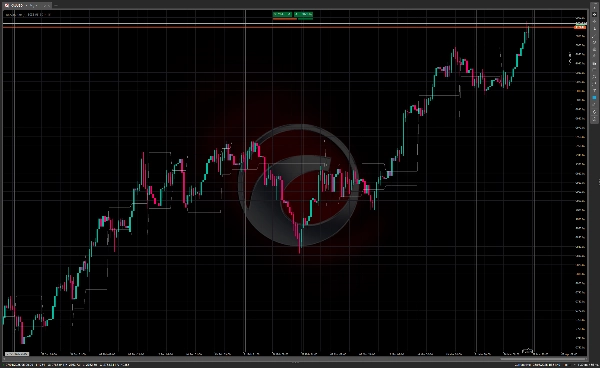
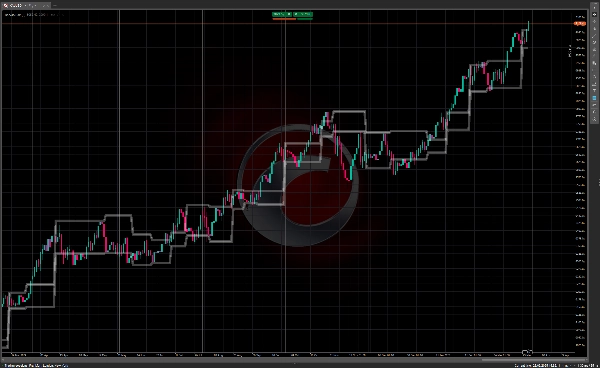
Kaedah Kotak Darvas melibatkan mengenal pasti "kotak" atau julat perdagangan di mana harga saham mengukuh sebelum melepasi. Komponen utama termasuk:
- Harga membentuk julat perdagangan yang ditakrifkan ( "kotak") dengan sempadan atas dan bawah yang jelas
- Sempadan atas mewakili rintangan, manakala sempadan bawah bertindak sebagai sokongan
- Pelepasan di atas kotak menandakan peluang pembelian yang berpotensi
- Penurunan di bawah kotak boleh digunakan sebagai isyarat jualan
Pedagang yang menggunakan teknik ini biasanya mencari saham yang menunjukkan peningkatan volum bersama dengan pergerakan harga, kerana ini menunjukkan momentum yang lebih kuat di sebalik pelepasan.
Sejarah Teori Kotak Darvas
Nicolas Darvas (1920-1977) adalah figura yang agak luar biasa dalam sejarah perdagangan. Dilahirkan di Hungary, dia bukan pedagang profesional berdasarkan latihan tetapi seorang penari yang membuat persembahan dalam duo tarian ballroom yang dipanggil "Darvas dan Julia" bersama saudara tirinya.
Semasa mengelilingi dunia dengan kumpulan tariannya pada tahun 1950-an, Darvas mula bereksperimen dengan perdagangan saham. Keadaannya unik—dia sering membuat keputusan pelaburan hanya berdasarkan jadual saham dalam surat khabar yang dihantarkan kepadanya di pelbagai bandar semasa lawatannya.
Darvas membangunkan teori kotaknya melalui cubaan dan kesilapan. Pada mulanya, dia kehilangan wang di pasaran tetapi secara beransur-ansur memperbaiki pendekatannya. Antara 1956 dan 1958, dia dilaporkan menukar pelaburan sebanyak $10,000 menjadi lebih $2 juta menggunakan kaedah kotaknya—suatu pencapaian luar biasa yang menarik perhatian.
Pada tahun 1960, Darvas menerbitkan kaedahnya dalam buku "How I Made $2,000,000 in the Stock Market," yang menjadi klasik dalam literatur perdagangan. Buku itu menceritakan perjalanannya dan menerangkan teori kotaknya, membawa pendekatan ini ke perhatian umum.
Apa yang menjadikan kaedah Darvas amat ketara ialah kesederhanaannya dan bahawa ia dibangunkan oleh seorang yang bukan dari industri kewangan. Dia memberi tumpuan terutamanya kepada tindakan harga dan volum daripada analisis asas, pendekatan yang agak baru pada masa itu tetapi sejak itu mempengaruhi banyak sistem perdagangan teknikal.
Teknik Kotak Darvas kekal popular di kalangan pedagang teknikal hari ini, terutamanya mereka yang mengikuti strategi berasaskan momentum dalam pasaran yang sedang tren.


