present
Zarejestruj się i otrzymaj 50 $ zniżki na pierwszy zakup
Trading product for Sample EMA Wskaźnik Supertrend ATR, image 1
Sample EMA
Wskaźnik
Wersja 1.0, Feb 2025
Windows, Mac
Od 13/02/2025

Opis

Podsumowanie

AI summary
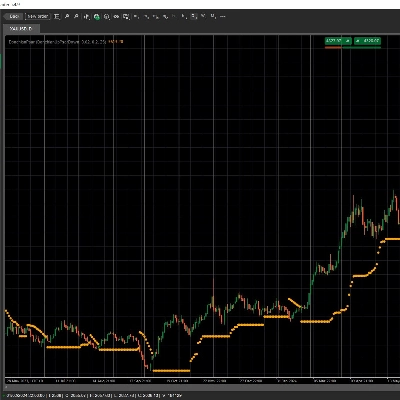
Sample EMA is an indicator for the cTrader (cAlgo) platform that combines the SuperTrend and Moving Average (MA) concepts into a single tool called SuperTrendMA. It calculates a user-selectable type of moving average (default is Exponential) over a specified period (MA Length). It also computes the Average True Range (ATR) over a defined ATR Period and applies an ATR Multiplier to generate SuperTrend bands. Market trends are identified based on price position relative to these bands: an uptrend is signaled when the price closes above the DownTrend Band, and a downtrend when it closes below the UpTrend Band. The indicator visually represents trends with colored lines—lime for uptrend and red for downtrend—and provides trade entry signals using arrows: green arrows indicate a shift from downtrend to uptrend (buy signal), and red arrows indicate a shift from uptrend to downtrend (sell signal). This indicator supports trend analysis and trade signal generation by integrating volatility and moving average data.
Profil wskaźnika

Opinie klientów

0.0
Opinie: 0
Opinie klientów
Ten produkt nie ma jeszcze opinii. Wypróbowałeś(-aś) go już? Bądź pierwszy(-a) i powiedz o tym innym!

Dyskusja

Częste pytania

Supertrend
ATR
Produkty dostępne za pośrednictwem cTrader Store, w tym boty handlowe, wskaźniki i wtyczki, dostarczane są przez deweloperów zewnętrznych i udostępniane wyłącznie w celach informacyjnych oraz w celu zapewnienia dostępu technicznego. cTrader Store nie jest brokerem i nie zapewnia doradztwa inwestycyjnego, nie udziela spersonalizowanych rekomendacji ani nie gwarantuje przyszłych wyników.


Możesz także polubić

Wskaźnik
ADX
ATR
+2
GOLD SENTINEL v1.0 - A CANDLE-COLORING INDICATOR FOR GOLD.
Wskaźnik
SMC
Forex
+7
Simple Smart Money Concepts (SMC)
Wskaźnik
Risk Dashboard
AI-powered daily range forecasts help traders spot volatility opportunities and plan stops and targets.
Wskaźnik
ADX
ATR
+5
10 Factors. One Signal. Zero Guesswork.
Wskaźnik
This indicator is an essential tool for traders seeking to visualize key trading sessions on their charts.
Wskaźnik
Imbalance
Fair Value Gap
+1
Multi-symbol, multi-timeframe Fair Value Gaps in one panel.
Wskaźnik
Grid
Prop
+5
This technical analysis indicator provides information on market sentiment, trend and price levels....
Wskaźnik
ATR
RSI
+5
Multi-factor VWAP mean-reversion signals with ATR bands, volume exhaustion, and RSI gate on cTrader.
Wskaźnik
RSI
SMC
+17
Turn WaveTrend Cross into a BTC profit machine precise buy sell signals, smart momentum edge, no lag trading system
Wskaźnik
ATR
Prop
+15
Initial Range – Where the open writes the script.
Wskaźnik
Block Liquidity,indicator.Block Order, Liquids Stops, Signal Sentiment,signal correctio.
Wskaźnik
ATR
VWAP
+17
Hybrid adaptive trend filter with clean Buy/Sell signals, dynamic bands and zero-repaint analysis.
Wskaźnik
Volume Profile plots traded volume at each price level, highlighting high activity zones of precise support & resistance
Wskaźnik
ATR
Volume
+3
Fibonacci trend signals on closed bars, with an ATR stop, up to four targets and a break-even ladder.
Wskaźnik
ATR
MACD
+15
BrickAlgo TrendPulse is an advanced technical analysis tool that combines multiple indicators with filterin mechanisms.
Wskaźnik
Volume
Key Levels
View tick activity across a selected chart range with Point of Control, Value Area High and Value Area Low.
Wskaźnik
Forex
BTCUSD
+3
Visualize market asymmetry like never before — steady climbs meet sudden drops with the Donchian PSAR
Wskaźnik
Signal
Breakout
+1
Bolliger Bands + Hamster-Coder™ Timeframe Decoupling

Cena

Od 13/02/2025