
Penerangan
Penunjuk sokongan dan rintangan berbilang jangka masa biasanya membolehkan pedagang memvisualisasikan tahap-tahap ini merentasi jangka masa yang berbeza, seperti carta setiap jam, harian, mingguan, atau bulanan. Dengan menggabungkan pelbagai jangka masa, pedagang boleh memperoleh perspektif yang lebih luas tentang di mana tahap harga utama terletak dan bagaimana ia mungkin mempengaruhi tindakan harga.
Jenis penunjuk ini boleh membantu pedagang membuat keputusan perdagangan yang lebih bermaklumat dengan mengenal pasti tahap sokongan dan rintangan yang penting yang mungkin memberi kesan kepada pergerakan harga dalam pelbagai jangka masa. Ia juga boleh membantu pedagang menjangka kemungkinan pembalikan atau peluang pecahan apabila harga menghampiri tahap-tahap ini merentasi pelbagai jangka masa.
Terdapat tiga jenis tahap sokongan & rintangan:
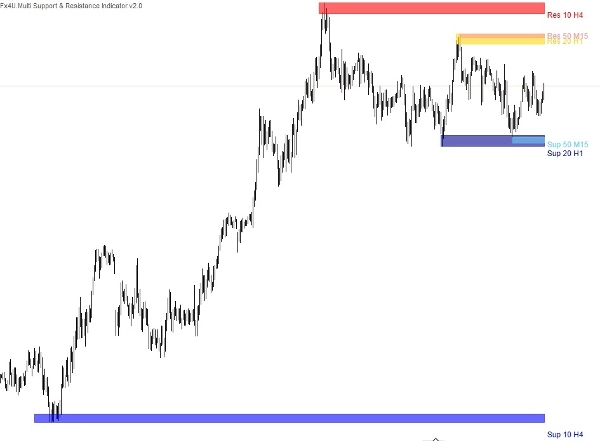
Tiga penunjuk sokongan dan rintangan dibina dalam penunjuk tunggal ini membolehkan anda melakar zon bekalan dan permintaan anda pada carta dengan tetapan berikut.
- Nilai tempoh.
- Jangka masa.
- Bilangan ekstremum – Ini adalah bilangan titik Sokongan/Rintangan semasa + lalu yang dipaparkan. Sebagai contoh, jika kita memilih 2, penunjuk akan memilih satu lagi titik Sokongan dan Rintangan pada masa lalu.
- Nama dan warna penunjuk.
Tahap sokongan dan rintangan yang penting pada jangka masa yang lebih tinggi cenderung mempunyai berat yang lebih dan dengan menggunakan penunjuk berbilang jangka masa, pedagang boleh mengesahkan kepentingan sesuatu tahap jika ia muncul secara konsisten merentasi pelbagai jangka masa. Pengesahan ini meningkatkan kebolehpercayaan tahap tersebut dan meningkatkan keyakinan pedagang dalam keputusan perdagangan mereka.
Produk saya yang lain:
https://ctrader.com/products/346
https://ctrader.com/products/336
https://ctrader.com/products/343
https://ctrader.com/products/347
https://ctrader.com/products/147
Ringkasan
The indicator consolidates three types of support and resistance levels into a single tool, allowing users to plot supply and demand zones with customizable settings such as period value, timeframe, the number of extremum points (current plus past support/resistance points), and indicator name and color. This multi-timeframe approach helps traders identify levels that carry more weight when confirmed across different timeframes, enhancing the reliability of these levels for decision-making.
By visualizing these critical zones, the indicator aids in anticipating potential price reversals or breakout opportunities. It supports a broader market overview, enabling more informed trading strategies based on the interaction of price with established support and resistance across various time horizons.
Ulasan pelanggan
5 | 33 % | |
4 | 67 % | |
3 | 0 % | |
2 | 0 % | |
1 | 0 % |
![Logo "[Fx4U] GBPUSD - Price Action"](https://cdn.ctrader.com/image/webp/d80b34fc-da3c-4f01-a321-456450665649_26190)

![Logo "[Fx4U] CADJPY - Price Action"](https://cdn.ctrader.com/image/webp/1ba81247-b6b7-4f3c-a297-fa3eb1d57fe1_26195)

![Logo "[Fx4U] AUDCHF - Price Action"](https://cdn.ctrader.com/image/webp/0a22e9aa-c83b-42cd-b0b8-c1a2da593207_26148)

![Logo "[Fx4U] EURAUD - Price Action"](https://cdn.ctrader.com/image/webp/baf8dde4-1ef3-4beb-8ae2-0fed8320f65d_26177)


