
설명
트렌드라인 지표란?
트렌드라인 지표는 트레이더와 분석가들이 금융 시장에서 추세의 방향과 강도를 식별하기 위해 사용하는 기술적 분석 도구입니다. 이는 차트에서 두 개 이상의 가격 지점을 연결하는 직선을 그리는 데 기반합니다. 트렌드라인의 주요 목적은 특정 기간 동안 가격 움직임의 일반적인 방향을 시각적으로 나타내는 것입니다.
다중 시간대 트렌드라인 지표
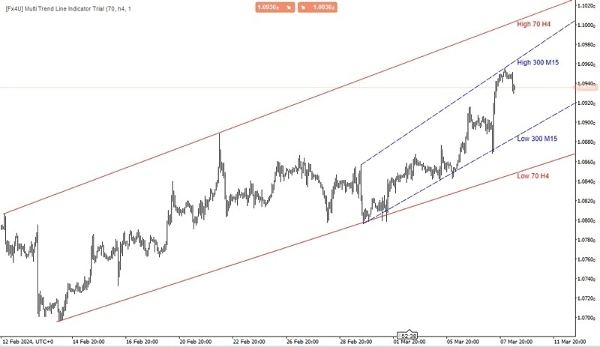
다중 시간대 트렌드라인 지표의 주요 기능은 다양한 시간대의 정보를 통합하여 트레이더에게 시장 추세에 대한 더 넓은 관점을 제공하는 것입니다. 여러 시간대의 추세를 분석함으로써 트레이더는 잠재적인 진입 및 종료 시점뿐만 아니라 시장의 전반적인 방향에 대해 더 신중한 결정을 내릴 수 있습니다.
이 유형의 지표는 일반적으로 트레이더가 분석하고자 하는 시간대를 사용자 정의하고 그에 따라 트렌드라인을 그릴 수 있도록 합니다. 이는 다양한 시간대에서 주요 지지 및 저항 수준, 추세 반전 및 추세 지속을 식별하는 데 유용한 도구가 되어 트레이더가 보다 정확한 거래 결정을 내리는 데 도움을 줍니다.
트렌드라인에는 다음과 같은 여러 유형이 있습니다:
- 상승 추세선: 가격 차트에서 두 개 이상의 연속된 저점을 연결하여 그립니다. 이는 가격이 전반적으로 상승하고 있음을 나타내는 상승 추세를 시사합니다.
- 하락 추세선: 반대로, 하락 추세선은 가격 차트에서 두 개 이상의 연속된 고점을 연결하여 그립니다. 이는 가격이 전반적으로 하락하고 있음을 나타내는 하락 추세를 시사합니다.
- 수평 추세선: 지지선 또는 저항선으로도 알려져 있으며, 가격 움직임이 멈추거나 반전되는 경향이 있는 영역을 나타내기 위해 수평으로 그립니다.
트레이더들은 종종 다른 기술 지표 및 분석 방법과 함께 트렌드라인을 사용하여 정보에 입각한 거래 결정을 내립니다. 트렌드라인이 깨지거나 돌파될 때, 이는 추세 방향의 잠재적 변화를 나타낼 수 있으며 투자자에게 거래 신호를 제공합니다.
내 다른 제품들:
https://ctrader.com/products/346
https://ctrader.com/products/336
https://ctrader.com/products/343
https://ctrader.com/products/347
https://ctrader.com/products/148
요약
고객 리뷰
5 | 67 % | |
4 | 0 % | |
3 | 33 % | |
2 | 0 % | |
1 | 0 % |
!["[Fx4U] GBPUSD - Price Action" 로고](https://cdn.ctrader.com/image/webp/d80b34fc-da3c-4f01-a321-456450665649_26190)

!["[Fx4U] CADJPY - Price Action" 로고](https://cdn.ctrader.com/image/webp/1ba81247-b6b7-4f3c-a297-fa3eb1d57fe1_26195)

!["[Fx4U] AUDCHF - Price Action" 로고](https://cdn.ctrader.com/image/webp/0a22e9aa-c83b-42cd-b0b8-c1a2da593207_26148)

!["[Fx4U] EURAUD - Price Action" 로고](https://cdn.ctrader.com/image/webp/baf8dde4-1ef3-4beb-8ae2-0fed8320f65d_26177)


