
설명
다중 시간대 지지 및 저항 지표는 일반적으로 트레이더가 시간별, 일별, 주별 또는 월별 차트와 같은 다양한 시간대에서 이러한 수준을 시각화할 수 있도록 합니다. 여러 시간대를 통합함으로써 트레이더는 주요 가격 수준이 어디에 위치하는지, 그리고 그것이 가격 움직임에 어떻게 영향을 미칠 수 있는지에 대한 더 넓은 관점을 얻을 수 있습니다.
이 유형의 지표는 다양한 시간대에 걸쳐 가격 움직임에 영향을 미칠 수 있는 중요한 지지 및 저항 수준을 식별함으로써 트레이더가 보다 정보에 입각한 거래 결정을 내리는 데 도움을 줄 수 있습니다. 또한 가격이 여러 시간대에 걸쳐 이러한 수준에 접근할 때 잠재적인 반전 또는 돌파 기회를 예상하는 데도 도움이 될 수 있습니다.
지지 및 저항 수준에는 세 가지 유형이 있습니다:
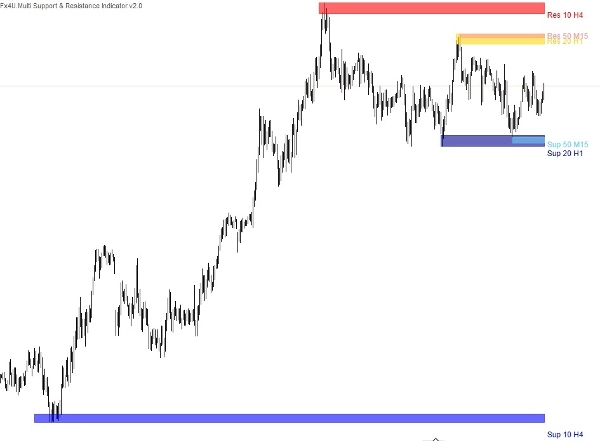
세 가지 지지 및 저항 지표가 이 단일 지표에 내장되어 있어 다음 설정으로 차트에 공급 및 수요 구역을 표시할 수 있습니다.
- 기간 값.
- 시간대.
- 극값의 수 – 현재 및 과거 지지/저항 점의 수를 나타냅니다. 예를 들어 2를 선택하면 지표가 과거의 또 다른 지지 및 저항 점을 선택합니다.
- 지표의 이름과 색상.
상위 시간대에서 중요한 지지 및 저항 수준은 더 큰 중요성을 가지는 경향이 있으며, 다중 시간대 지표를 사용하면 여러 시간대에 걸쳐 일관되게 나타나는 수준의 중요성을 확인할 수 있습니다. 이러한 확인은 수준의 신뢰성을 높이고 트레이더가 거래 결정을 내리는 데 자신감을 향상시킵니다.
내 다른 제품들:
https://ctrader.com/products/346
https://ctrader.com/products/336
https://ctrader.com/products/343
https://ctrader.com/products/347
https://ctrader.com/products/147
요약
The indicator consolidates three types of support and resistance levels into a single tool, allowing users to plot supply and demand zones with customizable settings such as period value, timeframe, the number of extremum points (current plus past support/resistance points), and indicator name and color. This multi-timeframe approach helps traders identify levels that carry more weight when confirmed across different timeframes, enhancing the reliability of these levels for decision-making.
By visualizing these critical zones, the indicator aids in anticipating potential price reversals or breakout opportunities. It supports a broader market overview, enabling more informed trading strategies based on the interaction of price with established support and resistance across various time horizons.
고객 리뷰
5 | 33 % | |
4 | 67 % | |
3 | 0 % | |
2 | 0 % | |
1 | 0 % |
!["[Fx4U] GBPUSD - Price Action" 로고](https://cdn.ctrader.com/image/webp/d80b34fc-da3c-4f01-a321-456450665649_26190)

!["[Fx4U] CADJPY - Price Action" 로고](https://cdn.ctrader.com/image/webp/1ba81247-b6b7-4f3c-a297-fa3eb1d57fe1_26195)

!["[Fx4U] AUDCHF - Price Action" 로고](https://cdn.ctrader.com/image/webp/0a22e9aa-c83b-42cd-b0b8-c1a2da593207_26148)

!["[Fx4U] EURAUD - Price Action" 로고](https://cdn.ctrader.com/image/webp/baf8dde4-1ef3-4beb-8ae2-0fed8320f65d_26177)


