
Zero Lag LSMA
อินดิเคเตอร์
6 การซื้อ
เวอร์ชัน 1.0, Aug 2025
Windows, Mac
4.6
รีวิว: 3
คำอธิบาย
Zero Lag LSMA (Least Squares Moving Average) เป็นตัวชี้วัดทางเทคนิคที่ทันสมัยออกแบบมาสำหรับเทรดเดอร์ที่ต้องการความตอบสนองและความแม่นยำที่สูงขึ้นในการวิเคราะห์แนวโน้ม แตกต่างจากค่าเฉลี่ยเคลื่อนที่แบบดั้งเดิมที่ล่าช้ากว่าการเคลื่อนไหวของราคา มันลดความล่าช้าโดยใช้กระบวนการถดถอยเชิงเส้นสองชั้น ทำให้เหมาะสำหรับการระบุทิศทางแนวโน้มและการกลับตัวที่เป็นไปได้แบบเรียลไทม์ ตัวชี้วัดนี้เหมาะสำหรับฟอเร็กซ์ หุ้น สินค้าโภคภัณฑ์ และตลาดอื่นๆ
คุณสมบัติหลัก
- ประสิทธิภาพแบบไม่มีดีเลย์: ลดความล่าช้าที่มีอยู่ในค่าเฉลี่ยเคลื่อนที่แบบดั้งเดิม ให้สัญญาณการเปลี่ยนแปลงแนวโน้มที่รวดเร็วขึ้น
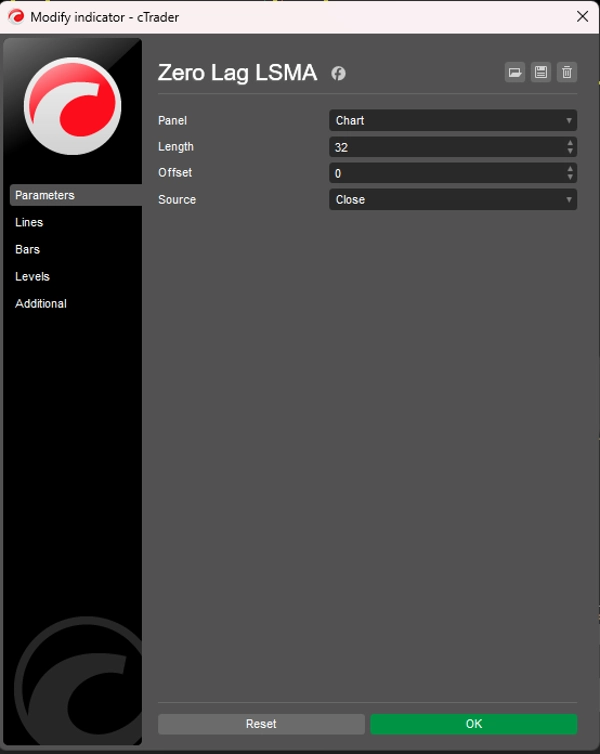
- พารามิเตอร์ที่ปรับแต่งได้: ปรับความยาว การเลื่อนตำแหน่ง และแหล่งราคาที่ใช้ (เปิด สูง ต่ำ ปิด) ให้เหมาะสมกับกลยุทธ์การเทรดของคุณ
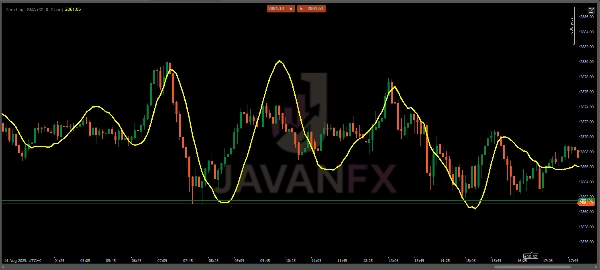
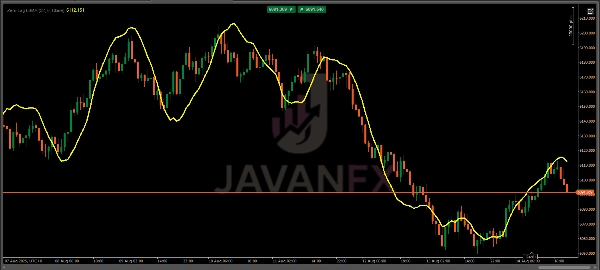
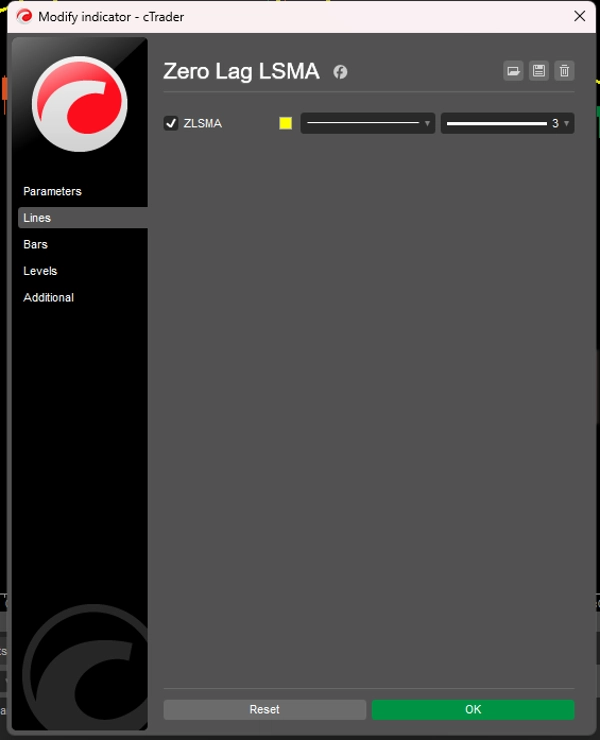
- เข้าใจง่ายด้วยสายตา: แสดงเป็นเส้นสีเหลืองเรียบเนียนทับบนกราฟราคาเพื่อการตีความที่ง่าย
- การใช้งานที่หลากหลาย: เหมาะสำหรับการสแคปปิ้ง การเทรดรายวัน การเทรดสวิง และกลยุทธ์ระยะยาวในช่วงเวลาต่างๆ
วิธีการใช้งาน
- การระบุแนวโน้ม:
-
- เมื่อเส้น ZLSMA มีแนวโน้มขึ้น แสดงถึงแนวโน้มขาขึ้น
- แนวโน้มลงแสดงถึงแนวโน้มขาลง
- การเคลื่อนไหวที่แบนหรือสลับไปมาอาจบ่งชี้ถึงการรวมตัวหรือไม่มีแนวโน้ม
- สัญญาณเข้า/ออก:
-
- สัญญาณซื้อ: เข้าตำแหน่งซื้อเมื่อราคาตัดขึ้นเหนือเส้น ZLSMA โดยเฉพาะหลังจากแนวโน้มขาขึ้นได้รับการยืนยัน
- สัญญาณขาย: เข้าตำแหน่งขายเมื่อราคาตัดลงต่ำกว่าเส้น ZLSMA ในช่วงแนวโน้มขาลง
- สัญญาณออก: พิจารณาออกเมื่อราคาตัดกลับผ่านเส้น ZLSMA หรือเมื่อเส้นแบนราบ แสดงถึงการกลับตัวของแนวโน้มที่เป็นไปได้
- การยืนยัน:
-
- รวม ZLSMA กับตัวชี้วัดอื่นๆ (เช่น RSI, MACD) หรือระดับแนวรับ/แนวต้าน เพื่อยืนยันสัญญาณและหลีกเลี่ยงการหลุดแนวเท็จ
- ใช้ในกรอบเวลาที่สูงขึ้น (H1, H4, D1) เพื่อสัญญาณแนวโน้มที่แข็งแกร่งขึ้น หรือกรอบเวลาที่ต่ำกว่า (M5, M15) สำหรับการสแคปปิ้ง
กลยุทธ์การเทรด
- ตามแนวโน้ม: ใช้ ZLSMA เพื่อขี่แนวโน้มที่แข็งแกร่งโดยเข้าซื้อในช่วงราคาย่อตัวกลับไปยังเส้น ZLSMA ตามทิศทางแนวโน้ม
- การเทรดกลับตัว: มองหาราคาที่เบี่ยงเบนจากเส้น ZLSMA ร่วมกับรูปแบบแท่งเทียน (เช่น พินบาร์ แท่งเทียนกลืน) สำหรับการตั้งค่าการกลับตัว
- การเทรดเบรกเอาท์: ติดตามการเบรกเอาท์ของราคาที่เหนือ/ต่ำกว่า ZLSMA ในช่วงเวลาที่มีความผันผวนสูงเพื่อหาจุดเข้าเทรดที่เป็นไปได้
เคล็ดลับสำหรับการใช้งานที่ดีที่สุด
- ปรับความยาวให้เหมาะกับสภาพตลาด: ใช้ความยาวสั้นกว่า (เช่น 10-20) สำหรับตลาดที่เร็วหรือการสแคปปิ้ง และความยาวที่ยาวกว่า (เช่น 50-100) สำหรับแนวโน้มที่ราบรื่นในกรอบเวลาที่สูงขึ้น
- ทดสอบในบัญชีทดลอง: ก่อนใช้งานจริง ให้ทดสอบ ZLSMA ในบัญชีทดลองเพื่อเข้าใจพฤติกรรมในตลาดที่คุณชื่นชอบ
- หลีกเลี่ยงการเทรดเกินในตลาดที่ผันผวน: ZLSMA ทำงานได้ดีที่สุดในตลาดที่มีแนวโน้ม ใช้ตัวกรองเพิ่มเติม (เช่น ADX) เพื่อหลีกเลี่ยงสัญญาณหลอกในตลาดที่เคลื่อนไหวไซด์เวย์
สรุป
สรุปโดย AI
The Zero Lag LSMA (Least Squares Moving Average) is a technical indicator designed to enhance trend analysis by minimizing the lag typical of traditional moving averages. It uses a double linear regression process to provide faster and more responsive signals, making it suitable for real-time identification of trend direction and potential reversals. The indicator is applicable across various markets including forex, stocks, and commodities.
Key features include customizable parameters such as length, offset, and price source (Open, High, Low, Close), allowing adaptation to different trading strategies. It displays as a smooth yellow line overlaid on the price chart for clear visual interpretation. The indicator supports multiple trading styles and timeframes, from scalping to long-term strategies.
Traders use the Zero Lag LSMA to identify trends by observing the slope of the line: upward for bullish trends, downward for bearish, and flat for consolidation. Entry and exit signals are generated when price crosses the LSMA line, with additional confirmation recommended through other indicators or support/resistance levels. The indicator supports trend following, reversal, and breakout trading strategies, with adjustable settings to optimize performance under varying market conditions.
โปรไฟล์อินดิเคเตอร์
รีวิวจากลูกค้า
4.6
รีวิว: 3
5 | 67 % | |
4 | 33 % | |
3 | 0 % | |
2 | 0 % | |
1 | 0 % |
รีวิวจากลูกค้า
October 10, 2025
Zero lag, full clarity ⚡ LSMA tracks price action like a scalpel — sharp, fast, and smooth. Great trend filter for any timeframe!
August 27, 2025
The only reason it stays interesting is the setup needs less second guessing. A normal demo run is enough to see the weak spots.
August 16, 2025
Not bad if the rules are already clear. Spread and slippage need a line in the notes.
การสนทนา
คำถามที่พบบ่อย
ผลิตภัณฑ์ที่มีให้บริการผ่าน cTrader Store รวมถึงบอทการเทรด อินดิเคเตอร์ และปลั๊กอิน มีให้บริการโดยนักพัฒนาบุคคลที่สามและมีไว้เพื่อวัตถุประสงค์ในการเข้าถึงข้อมูลและทางเทคนิคเท่านั้น cTrader Store ไม่ใช่โบรกเกอร์และไม่ได้ให้คำแนะนำการลงทุน คำแนะนำส่วนบุคคล หรือการรับประกันผลการดำเนินงานในอนาคต


ราคา
ตั้งแต่ 14/07/2025
60
การขาย