
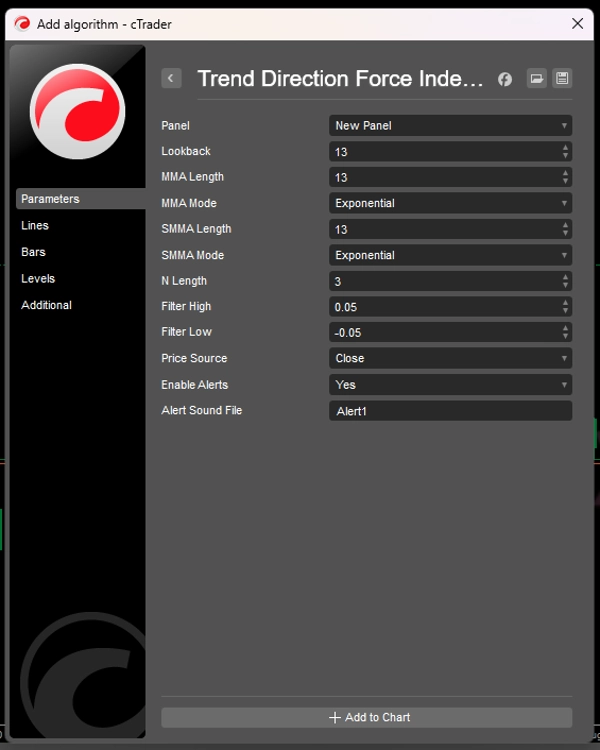
คำอธิบาย
ดัชนีแรงทิศทางแนวโน้ม (Trend Direction Force Index - TDFI) เป็นตัวชี้วัดโมเมนตัมที่ทรงพลังซึ่งออกแบบมาเพื่อช่วยเทรดเดอร์ระบุการเคลื่อนไหวของแนวโน้มที่แข็งแกร่งและการกลับตัวที่เป็นไปได้อย่างแม่นยำ โดยการวิเคราะห์ความสัมพันธ์ระหว่างค่าเฉลี่ยเคลื่อนที่สองค่าและอัตราการเปลี่ยนแปลงของพวกมัน TDFI จะกรองเสียงรบกวนของตลาดและเน้นโอกาสการเทรดที่มีความน่าจะเป็นสูง
คุณสมบัติหลัก:
✅ การระบุแนวโน้มที่ชัดเจน – แยกแยะโมเมนตัมขาขึ้น (สีเขียว) และขาลง (สีแดง) ได้อย่างชัดเจนตามเกณฑ์ที่ปรับแต่งได้
✅ การปรับความเรียบแบบปรับตัว – ใช้ประเภทค่าเฉลี่ยเคลื่อนที่หลายแบบ (EMA, WMA, Hull, TEMA ฯลฯ) เพื่อความตอบสนองที่เหมาะสมที่สุด
✅ การลดเสียงรบกวน – การทำให้เป็นมาตรฐานแบบไดนามิกช่วยให้สัญญาณเกิดขึ้นเฉพาะเมื่อมีการเคลื่อนไหวของราคาที่สำคัญเท่านั้น
✅ การแจ้งเตือนที่ปรับแต่งได้ – รับการแจ้งเตือนแบบเรียลไทม์เมื่อแนวโน้มแข็งแกร่งขึ้นหรือตีกลับ
✅ ใช้งานได้กับทุกกรอบเวลา – มีประสิทธิภาพสำหรับการสแคปปิ้ง การเทรดรายวัน และการเทรดสวิง
วิธีการทำงานของ TDFI
TDFI วัดความแข็งแกร่งของแนวโน้มโดยการวิเคราะห์ ความแตกต่าง และ โมเมนตัม ระหว่างค่าเฉลี่ยเคลื่อนที่สองค่าแบบปรับแต่งพิเศษ:
- MMA (ค่าเฉลี่ยเคลื่อนที่หลัก) – ติดตามโมเมนตัมราคาระยะสั้น
- SMMA (ค่าเฉลี่ยเคลื่อนที่เรียบ) – ระบุแนวโน้มพื้นฐาน
ตัวชี้วัดจะคำนวณ:
🔹 แรงความแตกต่าง – ระยะห่างระหว่าง MMA (ความแข็งแกร่งของแนวโน้ม)
🔹 การเร่งโมเมนตัม – ความเร็วที่แนวโน้มเคลื่อนที่
🔹 ผลลัพธ์ที่ทำให้เป็นมาตรฐาน – ปรับสัญญาณเพื่อหลีกเลี่ยงค่าที่สุดโต่ง
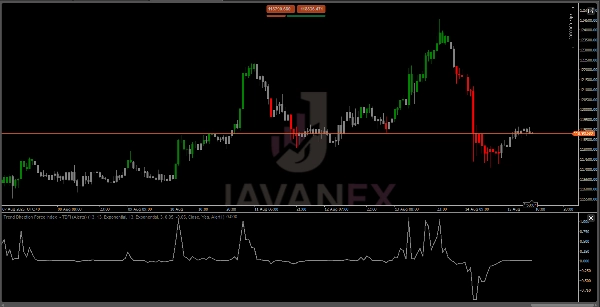
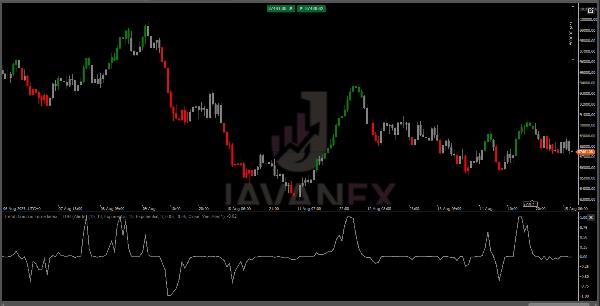
เมื่อแรงเหล่านี้รวมกัน:
- TDFI > เกณฑ์บน (สีเขียว) = โมเมนตัมขาขึ้นที่แข็งแกร่ง
- TDFI < เกณฑ์ล่าง (สีแดง) = โมเมนตัมขาลงที่แข็งแกร่ง
- ระหว่างเกณฑ์ (สีเทา) = เป็นกลาง/รวมตัว
สรุป
รีวิวจากลูกค้า
5 | 75 % | |
4 | 25 % | |
3 | 0 % | |
2 | 0 % | |
1 | 0 % |


