
LT_SmartSwings
อินดิเคเตอร์
6 การซื้อ
เวอร์ชัน 1.0, Jun 2025
Windows, Mac
5.0
รีวิว: 1
คำอธิบาย
หมายเหตุ: ทดสอบบน cTrader Windows เท่านั้น
LT_SmartSwings เป็นตัวบ่งชี้โครงสร้างตลาดแบบสวิงที่ทรงพลัง ออกแบบมาเพื่อช่วยเทรดเดอร์ในการมองเห็นจุดเปลี่ยนสำคัญ การเคลื่อนไหวของตลาด และเหตุการณ์เบรกเอาต์อย่างชัดเจนและยืดหยุ่น สร้างขึ้นเพื่อความแม่นยำและความสามารถในการปรับตัว เครื่องมือนี้เหมาะสำหรับเทรดเดอร์ที่พึ่งพาเหตุผลแบบสวิง การรวมตัวของฟีโบนักชี และการวิเคราะห์เบรกเอาต์
คุณสมบัติหลัก:
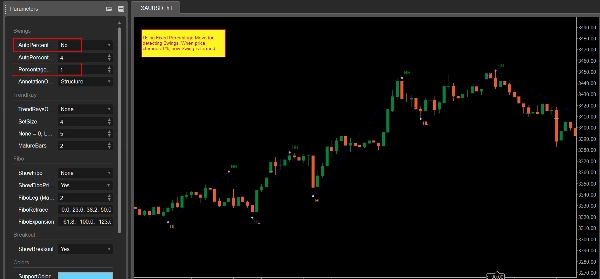
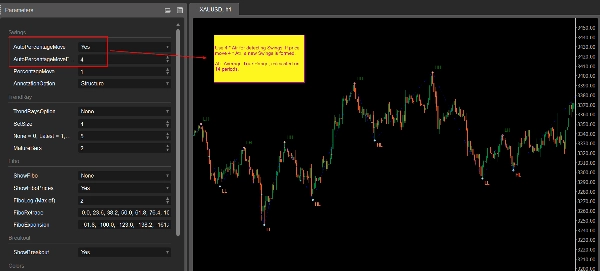
- การตรวจจับ Swing สูง/ต่ำ ตามเปอร์เซ็นต์การเคลื่อนไหวของราคา
- เกณฑ์อัตโนมัติหรือด้วยตนเอง: ใช้ % คงที่หรือโหมดอัตโนมัติ (ตาม ATR x ปัจจัย)
- เส้น ZigZag เชื่อมต่อสวิงสำคัญ
- คำอธิบายรายละเอียด พร้อม 5 โหมด:
-
- โครงสร้าง: HH, HL, LH, LL
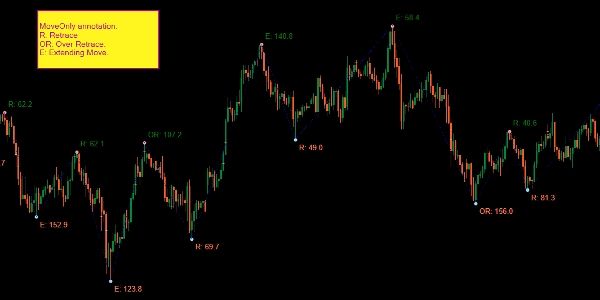
- MoveOnly: เปอร์เซ็นต์การย้อนกลับ (R) และการขยาย (E)
- PriceOnly
- MoveNPrice
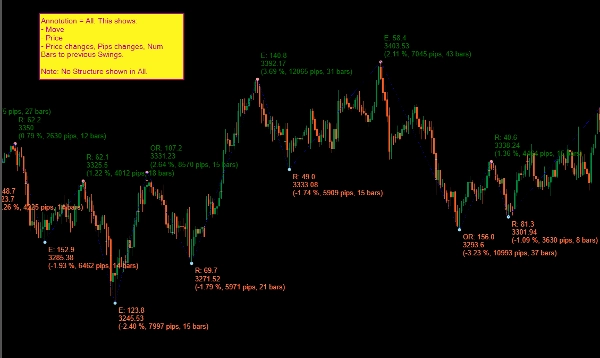
- ทั้งหมด: เปอร์เซ็นต์การเคลื่อนไหว, พิปส์, แท่ง, ราคา, ประเภทการเคลื่อนไหว
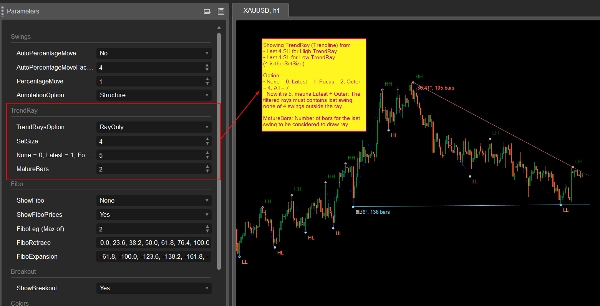
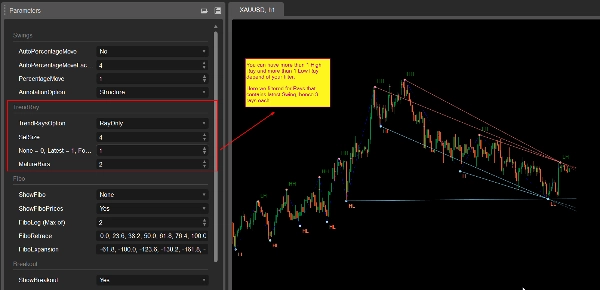
- การฉายรังสีแนวโน้ม (พร้อมตัวกรองหลายตัวเลือก):
-
- วาดรังสีจากสวิงล่าสุดโดยใช้ข้อจำกัดอัจฉริยะ
- ตัวเลือก: ล่าสุด, โฟกัส (ความชัน), ภายนอก หรือทั้งหมด
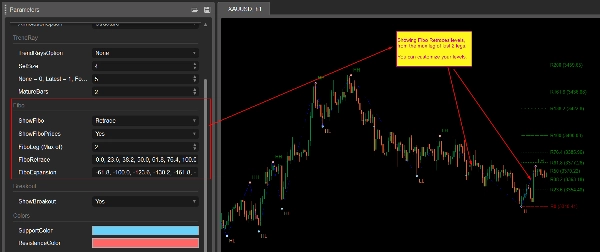
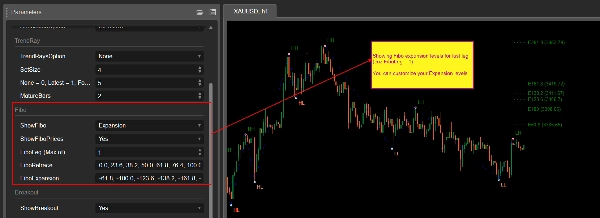
- ระดับฟีโบนักชีอัตโนมัติ:
-
- วาดระดับการย้อนกลับหรือการขยายตามการเคลื่อนไหวล่าสุด
- ชุดระดับที่ผู้ใช้กำหนดค่าได้
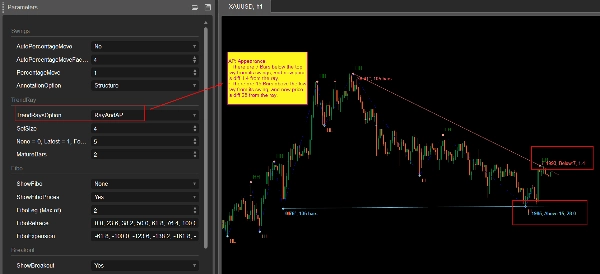
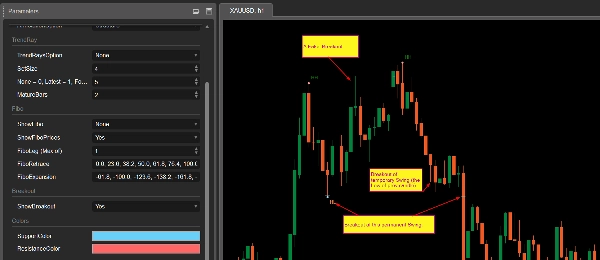
- การทำเครื่องหมายเบรกเอาต์:
-
- ตรวจจับการเบรกเอาต์ของจุดสวิง (ทั้งเบรกเอาต์ที่ยืนยันและเท็จ)
- แสดงผลอย่างต่อเนื่องเพื่ออ้างอิงประวัติ
- การปรับแต่งสี สำหรับเส้นแนวรับ/แนวต้าน
กรณีการใช้งาน:
- ระบุแนวรับ/แนวต้านแบบไดนามิก
- เข้าใจโครงสร้างสวิงและการเปลี่ยนแปลง
- สังเกตการต่อเนื่องหรือการกลับตัวของแนวโน้มโดยใช้ฟีบส์
- มองเห็นจุดเบรกเอาต์เพื่อวางแผนการเทรด
- รวมกับระบบที่มีอยู่หรือกลยุทธ์ตามดุลยพินิจของคุณ
คำแนะนำการใช้งาน:
- แนบกับกรอบเวลาที่คุณใช้งาน (เช่น M30, H1)
- เหมาะสำหรับเทรดเดอร์มือ, นักวิเคราะห์โครงสร้าง และกลยุทธ์ที่ใช้การยืนยัน
ข้อเสนอเปิดตัว: มีจำหน่ายแล้วในราคาเพียง $15!
สรุป
สรุปโดย AI
LT_SmartSwings is a swing-based market structure indicator designed for traders to identify key turning points, market moves, and breakout events with precision and flexibility. It detects swing highs and lows based on price movement percentage, using either fixed or automatic thresholds derived from ATR. The indicator connects key swings with a ZigZag line and provides detailed annotations in five modes, including structure (HH, HL, LH, LL), move percentages, price-only, combined move and price, and comprehensive move data.
Additional features include trend ray projection with multiple filtering options, automatic Fibonacci retracement and expansion levels customizable by the user, and breakout marking that detects both confirmed and false breakouts with persistent historical display. Support and resistance lines can be color-customized.
Use cases cover dynamic support/resistance identification, understanding swing structure and transitions, spotting trend continuation or reversal via Fibonacci levels, visualizing breakout points for trade planning, and integration with existing trading systems or discretionary strategies. It is recommended for manual traders, structure analysts, and confirmation-based strategies, and is intended for use on working timeframes such as M30 or H1. The indicator has been tested on cTrader Windows.
โปรไฟล์อินดิเคเตอร์
รีวิวจากลูกค้า
5.0
รีวิว: 1
5 | 100 % | |
4 | 0 % | |
3 | 0 % | |
2 | 0 % | |
1 | 0 % |
การสนทนา
คำถามที่พบบ่อย
Breakout
ATR
ผลิตภัณฑ์ที่มีให้บริการผ่าน cTrader Store รวมถึงบอทการเทรด อินดิเคเตอร์ และปลั๊กอิน มีให้บริการโดยนักพัฒนาบุคคลที่สามและมีไว้เพื่อวัตถุประสงค์ในการเข้าถึงข้อมูลและทางเทคนิคเท่านั้น cTrader Store ไม่ใช่โบรกเกอร์และไม่ได้ให้คำแนะนำการลงทุน คำแนะนำส่วนบุคคล หรือการรับประกันผลการดำเนินงานในอนาคต


ราคา
ตั้งแต่ 25/09/2024
34
การขาย