
KANDIKA HEAT MAP
อินดิเคเตอร์
1 การซื้อ
เวอร์ชัน 1.0, Jul 2025
Windows, Mac
4.6
รีวิว: 3
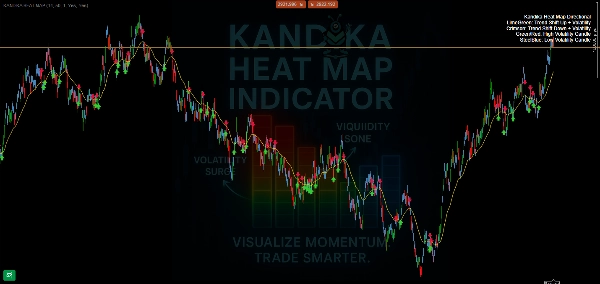
🎨 ตรรกะสี – สิ่งที่บอกคุณ
- 🟩 เขียวมะนาว → แนวโน้มเปลี่ยนขึ้น
กำลังเกิดการเปลี่ยนแปลงโมเมนตัมขาขึ้น ใช้มันเพื่อจับโอกาสขาขึ้นในช่วงต้น - 🟥 แดงเข้ม → แนวโน้มเปลี่ยนลง
สัญญาณแรงกดดันขาลงกำลังเพิ่มขึ้น เตรียมตัวสำหรับการชอร์ตหรือออกจากตลาด - 🟧/🔴 ส้ม/แดง → โซนความผันผวนสูง
คาดการณ์ราคาพุ่งขึ้น เคลื่อนไหวรวดเร็ว และกับดักที่อาจเกิดขึ้น ไม่ใช่ที่ที่ควรเดาแบบไม่ระวัง—ยืนยันกลยุทธ์ของคุณ - 🟦 น้ำเงินเหล็ก → โซนความผันผวนต่ำ
ตลาดกำลังชะลอตัว บีบตัว หรือเคลื่อนไหวในกรอบ มักเตรียมพร้อมสำหรับโอกาสเบรกเอาต์
📊 สิ่งที่ทำ (และไม่ทำ)
- ✅ แสดงแผนที่การเปลี่ยนทิศทางแนวโน้มอย่างชัดเจน
- ✅ แยกโซนที่สงบกับโซนที่ผันผวนอย่างชัดเจน
- ✅ โอเวอร์เลย์ที่เรียบง่ายและเหมาะกับกราฟ—ไม่มีความรก
โปรไฟล์อินดิเคเตอร์
4.6
รีวิว: 3
5 | 67 % | |
4 | 33 % | |
3 | 0 % | |
2 | 0 % | |
1 | 0 % |
รีวิวจากลูกค้า
August 4, 2025
No reason to yolo this live without a few normal sessions, and Bad settings can ruin the idea.
July 26, 2025
20 percent less clicking is the line to watch. Market checks feel quicker.
ผลิตภัณฑ์ที่มีให้บริการผ่าน cTrader Store รวมถึงบอทการเทรด อินดิเคเตอร์ และปลั๊กอิน มีให้บริการโดยนักพัฒนาบุคคลที่สามและมีไว้เพื่อวัตถุประสงค์ในการเข้าถึงข้อมูลและทางเทคนิคเท่านั้น cTrader Store ไม่ใช่โบรกเกอร์และไม่ได้ให้คำแนะนำการลงทุน คำแนะนำส่วนบุคคล หรือการรับประกันผลการดำเนินงานในอนาคต

!["[Stellar Strategies] MARSI Signal Plotter" โลโก้](https://cdn.ctrader.com/image/webp/7b2b8da6-8f8e-4646-8d4a-4710c516c01e_25567)


ตั้งแต่ 08/06/2025
1
การขาย