
คำอธิบาย
ตัวบ่งชี้นี้ถูกออกแบบมาเพื่อทำการวิเคราะห์การถดถอยเชิงเส้นหลายตัวแปรแบบไม่เชิงเส้นโดยใช้ตัวแปรอิสระสี่ตัว: ราคาปิด, ราคาเปิด, ราคาสูงสุด และราคาต่ำสุด
นี่คือส่วนประกอบและฟังก์ชันการทำงาน:
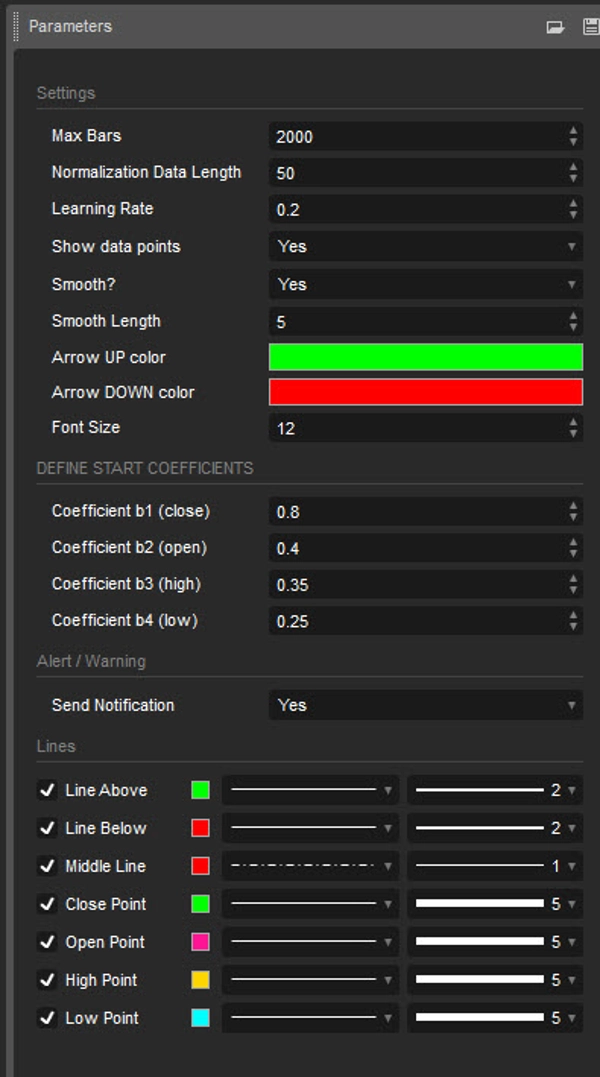
อินพุต:
- ความยาวข้อมูลสำหรับการทำ normalization: ความยาวของข้อมูลที่ใช้สำหรับการทำ normalization
- อัตราการเรียนรู้: อัตราที่อัลกอริทึมเรียนรู้จากข้อผิดพลาด
- แสดงจุดข้อมูล: แสดงการพล็อตข้อมูลอินพุตที่ถูก normalized (ราคาปิด, ราคาเปิด, ราคาสูงสุด, ราคาต่ำสุด)
- ทำให้เรียบ?: ตัวเลือกสำหรับการทำให้ผลลัพธ์เรียบ
- ความยาวการทำให้เรียบ: ความยาวของการทำให้เรียบหากเปิดใช้งาน
- กำหนดสัมประสิทธิ์เริ่มต้น: สัมประสิทธิ์เริ่มต้นสำหรับสมการถดถอย
การทำ normalization ข้อมูล:
สคริปต์จะทำการ normalize ข้อมูลอินพุตให้อยู่ในช่วงระหว่าง 0 ถึง 1 โดยใช้ค่าสูงสุดและต่ำสุดภายในความยาวที่กำหนด
การถดถอยเชิงเส้นหลายตัวแปรแบบไม่เชิงเส้น:
มันคำนวณสมการถดถอยโดยใช้สัมประสิทธิ์อินพุตและข้อมูลที่ถูก normalized สมการที่ใช้คือผลรวมถ่วงน้ำหนักของตัวแปรอิสระ โดยมีการปรับสัมประสิทธิ์อย่างต่อเนื่องโดยใช้ gradient descent เพื่อลดข้อผิดพลาด
การคำนวณข้อผิดพลาด:
สคริปต์จะคำนวณข้อผิดพลาดระหว่างค่าจริงและค่าที่ทำนาย
Gradient Descent:
สัมประสิทธิ์จะถูกอัปเดตอย่างต่อเนื่องโดยใช้ gradient descent เพื่อลดข้อผิดพลาด
การแสดงผล:
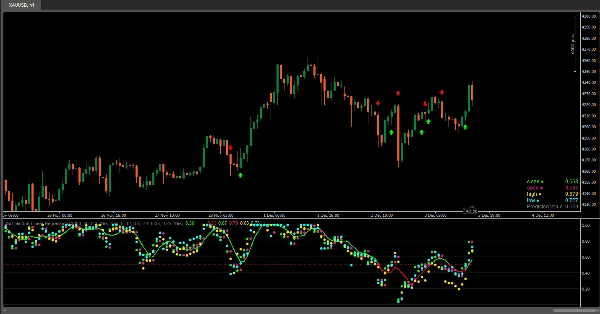
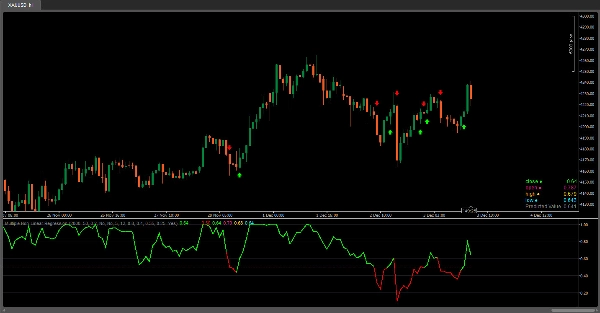
- การพล็อตข้อมูลอินพุตที่ถูก normalized (ราคาปิด, ราคาเปิด, ราคาสูงสุด, ราคาต่ำสุด)
- ตัวบ่งชี้แสดงการแสดงผลของค่าข้อมูลที่ถูก normalized (ราคาปิด, ราคาเปิด, ราคาสูงสุด, ราคาต่ำสุด) ในรูปแบบของเครื่องหมายวงกลมบนแผนภูมิ ช่วยให้ผู้ใช้สังเกตตำแหน่งสัมพัทธ์ของค่าต่าง ๆ เหล่านี้เมื่อเทียบกับกันและเส้นถดถอยได้อย่างง่ายดาย
- การพล็อตเส้นถดถอย
- การไล่ระดับสีบนเส้นถดถอยตามค่าของมันและสีของแท่ง
- การแสดงข้อมูลอินพุตที่ถูก normalized และค่าที่ทำนายในตาราง
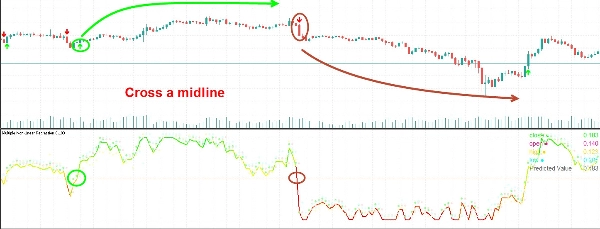
- สัญญาณสำหรับการตัดกันกับเส้นกลาง (0.5)
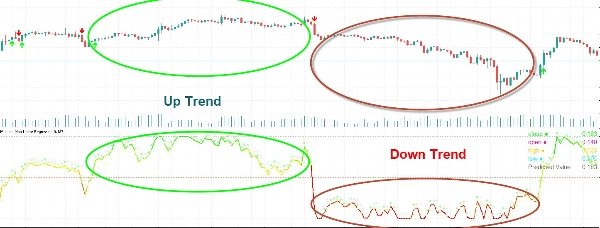
การตีความ:
ผู้ใช้สามารถตีความเส้นถดถอยและการตัดกันกับเส้นกลาง (0.5) เป็นสัญญาณสำหรับโอกาสในการซื้อหรือขายที่เป็นไปได้
ตัวบ่งชี้นี้ช่วยให้ผู้ใช้วิเคราะห์ความสัมพันธ์ระหว่างตัวแปรหลายตัวและตัดสินใจซื้อขายโดยอิงจากการวิเคราะห์ถดถอย การปรับสัมประสิทธิ์และพารามิเตอร์สามารถปรับแต่งประสิทธิภาพของโมเดลให้เหมาะสมกับสภาพตลาดเฉพาะได้
สรุป
รีวิวจากลูกค้า
5 | 100 % | |
4 | 0 % | |
3 | 0 % | |
2 | 0 % | |
1 | 0 % |


!["[Stellar Strategies] Inside Bar with Signals" โลโก้](https://cdn.ctrader.com/image/webp/1d9e8bfa-3b2c-4440-bb37-5856902008a7_30683)


