
คำอธิบาย
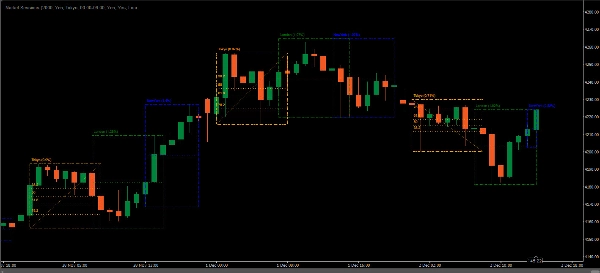
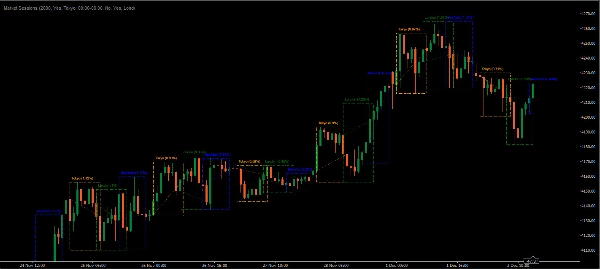
ตัวบ่งชี้ Market Sessions เป็นเครื่องมือยอดนิยมในหมู่นักเทรดฟอเร็กซ์และหุ้นสำหรับแสดงภาพช่วงเวลาการซื้อขายทั่วโลกบนกราฟราคาอย่างชัดเจน มันเน้นช่วงเวลาของเซสชันการซื้อขายหลัก ๆ เช่น เอเชีย (โตเกียว), ยุโรป (ลอนดอน) และ อเมริกา (นิวยอร์ก) โดยตรงบนกราฟ ช่วยให้นักเทรดระบุเวลาที่ตลาดเปิดและปิดได้ ซึ่งช่วยให้ตัดสินใจได้ดีขึ้นโดยอิงจากพฤติกรรมการซื้อขายเฉพาะเซสชัน
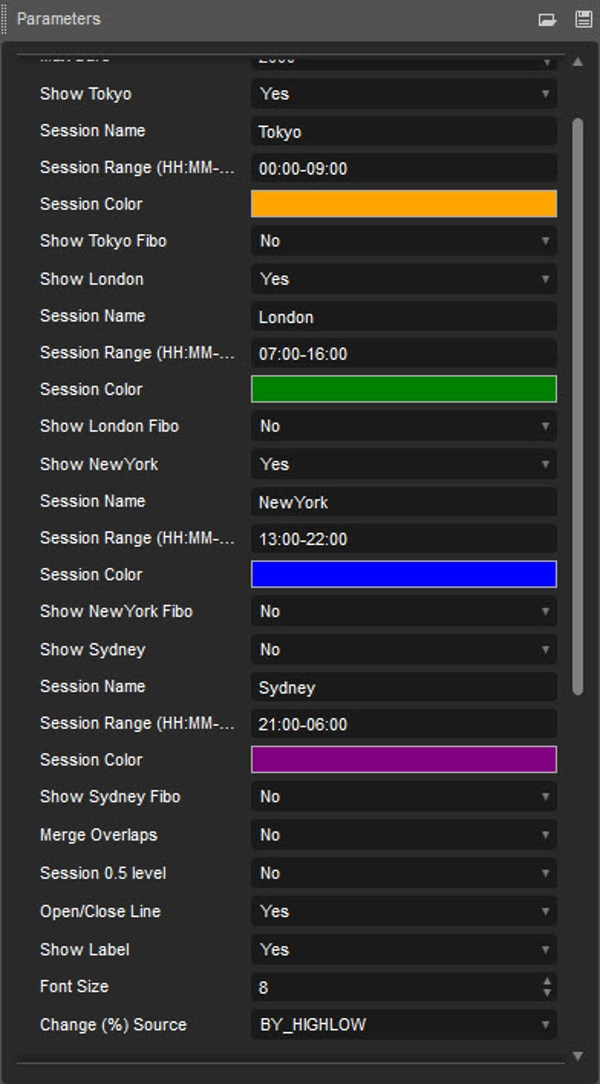
- เซสชันเอเชีย (ค่าเริ่มต้น: 00:00-09:00)
- เซสชันลอนดอน (ค่าเริ่มต้น: 07:00-16:00)
- เซสชันนิวยอร์ก (ค่าเริ่มต้น: 13:00-22:00)
- เซสชันซิดนีย์ (ค่าเริ่มต้น: 21:00-06:00)
คุณสมบัติหลักของตัวบ่งชี้ Market Sessions
- เวลาของเซสชันและการทับซ้อน:
-
- ตัวบ่งชี้จะแสดงเวลาที่เริ่มต้นและสิ้นสุดของแต่ละเซสชัน ฟีเจอร์นี้มีประโยชน์เพราะแต่ละเซสชันมีลักษณะเฉพาะ — เซสชันเอเชียโดยทั่วไปจะเงียบสงบกว่า ขณะที่เซสชันลอนดอนมักมีความผันผวนสูง การทับซ้อน เช่น การทับซ้อนระหว่างลอนดอนกับนิวยอร์ก ก็ถูกทำเครื่องหมายเช่นกัน ซึ่งบ่งชี้ช่วงเวลาที่มีกิจกรรมเพิ่มขึ้น
- สีของเซสชันที่ปรับแต่งได้:
-
- นักเทรดมักสามารถปรับแต่งสีสำหรับแต่ละเซสชันได้ ซึ่งช่วยให้แยกแยะเซสชันต่าง ๆ ได้ง่ายขึ้นด้วยสายตา การปรับแต่งนี้เพิ่มความชัดเจนและช่วยให้นักเทรดโฟกัสกับเซสชันที่ต้องการได้ดีขึ้น
- โซนเวลาที่ปรับได้:
-
- เนื่องจากนักเทรดอยู่ทั่วโลก ตัวบ่งชี้จึงมักอนุญาตให้ปรับโซนเวลาได้ เพื่อให้เวลาที่เริ่มและสิ้นสุดของเซสชันสอดคล้องกับเวลาท้องถิ่นของนักเทรด ซึ่งมีประโยชน์อย่างยิ่งสำหรับผู้ที่อยู่ในโซนเวลาที่แตกต่างจากศูนย์กลางการซื้อขายหลัก
- กลยุทธ์เฉพาะเซสชัน:
-
- แต่ละเซสชันมีลักษณะเฉพาะ เช่น เซสชันลอนดอน มักจะมีความผันผวนสูงสุด เปิดโอกาสสำหรับการเบรคเอาท์ ขณะที่ เซสชันเอเชีย มักจะเงียบสงบกว่า เหมาะกับกลยุทธ์การเทรดแบบช่วงราคา การเข้าใจความแตกต่างเหล่านี้ช่วยให้นักเทรดปรับกลยุทธ์ให้เหมาะสมกับแนวโน้มของแต่ละเซสชัน
ทำไมต้องใช้ตัวบ่งชี้ Market Sessions?
- การจับเวลาการเทรดที่ดีขึ้น:
-
- โดยการรู้ว่าเซสชันใดกำลังเปิดใช้งาน นักเทรดสามารถปรับกลยุทธ์เพื่อใช้ประโยชน์จากระดับความผันผวนและสภาพคล่องที่แตกต่างกันได้
- การวิเคราะห์และพัฒนากลยุทธ์ที่ดีขึ้น:
-
- ด้วยเวลาของเซสชันที่แสดงอย่างชัดเจน นักเทรดสามารถวิเคราะห์พฤติกรรมราคาข้ามเซสชันเพื่อพัฒนากลยุทธ์ที่เหมาะสมกับลักษณะเฉพาะของแต่ละเซสชันได้
- การรับรู้ความผันผวนของตลาดที่เพิ่มขึ้น:
-
- ความผันผวนมักจะพุ่งสูงขึ้นในช่วงเปิด ปิด และช่วงทับซ้อนของเซสชัน ตัวบ่งชี้ช่วยให้คาดการณ์การเคลื่อนไหวเหล่านี้ได้ ลดความเสี่ยงที่จะถูกจับโดยไม่ทันตั้งตัวจากการเปลี่ยนแปลงตลาดอย่างรวดเร็ว
ตัวอย่างการใช้งาน
นักเทรดที่สนใจความผันผวนอาจมุ่งเป้าไปที่ช่วงเวลาทับซ้อนระหว่างลอนดอนกับนิวยอร์กเพื่อใช้ประโยชน์จากการเคลื่อนไหวของตลาดที่สูงขึ้น โดยใช้ตัวบ่งชี้ Market Sessions พวกเขาสามารถวางแผนการเทรดให้ตรงกับช่วงเวลาทับซ้อนนี้ ซึ่งอาจเพิ่มโอกาสในการจับการเคลื่อนไหวของราคาที่สำคัญ
สรุปแล้ว ตัวบ่งชี้ Market Sessions เป็นสิ่งจำเป็นสำหรับนักเทรดที่ต้องการตัดสินใจอย่างมีข้อมูลโดยอิงจากพฤติกรรมตลาดตามช่วงเวลา มันช่วยเพิ่มความชัดเจน เสริมการวิเคราะห์ และสนับสนุนกลยุทธ์การเทรดที่มีประสิทธิภาพมากขึ้น
สรุป
รีวิวจากลูกค้า
5 | 33 % | |
4 | 67 % | |
3 | 0 % | |
2 | 0 % | |
1 | 0 % |


!["Gaussian Channel [Iridio Capital]" โลโก้](https://cdn.ctrader.com/image/webp/7c039209-5573-4a54-a072-f9528b503103_41960)


