คำอธิบาย
https://chartshots.spotware.com/c/695bff3f3bc21
https://chartshots.spotware.com/c/695bffac03fb1
https://chartshots.spotware.com/c/695c0002aabb7
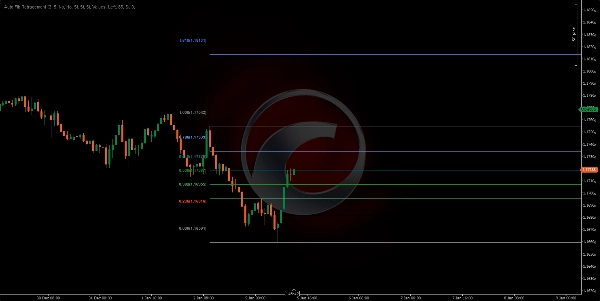
📊 Auto Fib Retracement
Auto Fib Retracement เป็นตัวชี้วัดการวิเคราะห์ทางเทคนิคที่ วาดระดับ Fibonacci retracement และ extension โดยอัตโนมัติ โดยอิงจากการเคลื่อนไหวของราคาที่สำคัญล่าสุด แตกต่างจากเครื่องมือ Fibonacci แบบแมนนวล ตัวชี้วัดนี้จะตรวจจับจุด pivot ของตลาดโดยอัตโนมัติและอัปเดตระดับใน เวลาจริง.
⚙️ มันทำงานอย่างไร?
การตรวจจับ Pivot อัตโนมัติ
ตัวชี้วัดใช้ алгоритм ZigZag แบบไดนามิกเพื่อระบุราคาสูงและต่ำที่สำคัญ:
- Lookback (ความลึก): กำหนดจำนวนแท่งเทียนย้อนหลังที่วิเคราะห์เพื่อยืนยันจุด pivot ค่าที่สูงกว่าจะตรวจจับการแกว่งที่ใหญ่กว่า ค่าที่ต่ำกว่าจะไวต่อการเคลื่อนไหวที่เล็กกว่า
- ความไว (Deviation): ควบคุมว่าการเคลื่อนไหวของราคาต้องมีความสำคัญแค่ไหนจึงจะก่อตัวเป็น pivot ใหม่ คำนวณโดยการคูณ ATR (Average True Range) 10 ช่วงเวลา ด้วยปัจจัยนี้ ค่าที่สูงกว่าจะกรองเสียงรบกวนและตรวจจับเฉพาะการเคลื่อนไหวที่สำคัญ
การคำนวณระดับ Fibonacci
เมื่อระบุ pivot สองจุดล่าสุด (สูงและต่ำ) ตัวชี้วัดจะคำนวณแต่ละระดับโดยใช้สูตร Fibonacci คลาสสิก:
ระดับ = ราคาจุดยึด + (ช่วงการเคลื่อนไหว × อัตราส่วน Fibonacci)
โดยที่:
- ราคาจุดยึด: ราคาของ pivot ล่าสุด (หรือจุดก่อนหน้าหากทิศทางกลับตัว)
- ช่วงการเคลื่อนไหว: ความแตกต่างระหว่างสอง pivot
- อัตราส่วนที่ใช้ได้: 0, 0.236, 0.382, 0.5, 0.618, 0.65, 0.786, 1, 1.272, 1.414, 1.618, 1.65, 2.618, 2.65, 3.618, 3.65, 4.236, 4.618, และระดับลบ (-0.236, -0.382, -0.618, -0.65)
📈 ใช้ทำอะไร?
UseDescription
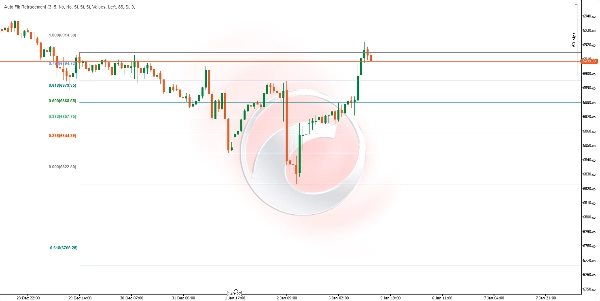
ระบุแนวรับและแนวต้าน
ระดับ 0.382, 0.5, และ 0.618 เป็นโซนคลาสสิกที่ราคามักจะตอบสนอง 🔵
กำหนดเป้าหมายราคา
ระดับขยาย (1.618, 2.618, 3.618, 4.236) ช่วยประมาณการว่าการเคลื่อนไหวอาจไปได้ไกลแค่ไหน 🎯
วางแผนการเข้าเทรด
มองหาการดีดกลับไปยังระดับสำคัญเพื่อเข้าเทรดตามทิศทางแนวโน้ม ⬆️⬇️
ตั้งจุดหยุดขาดทุน
วางจุดหยุดเกินระดับ Fibonacci ที่เกี่ยวข้อง 🛑
ยืนยันโซนกลับตัว
เมื่อราคาถึงระดับขยายสุดขีด อาจบ่งชี้ถึงการหมดแรง 🔄
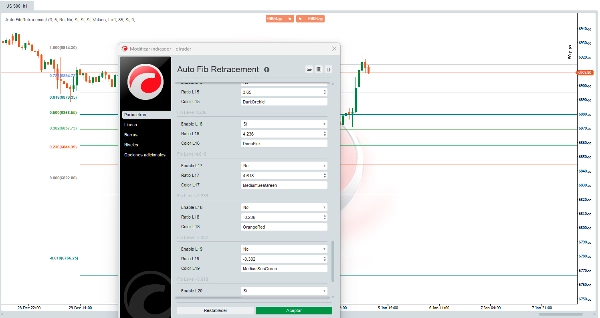
🛠️ วิธีใช้
พารามิเตอร์หลัก
คำอธิบายพารามิเตอร์ ค่าที่แนะนำ
ความไว
ตัวคูณความเบี่ยงเบนเพื่อกรองการเคลื่อนไหวเล็กน้อย
3 (ค่าเริ่มต้น)
Lookback
จำนวนแท่งเทียนขั้นต่ำสำหรับคำนวณ pivot
10 (ค่าเริ่มต้น)
สลับทิศทาง
สลับจุดอ้างอิงสำหรับการคำนวณระดับ
ปิดใช้งาน
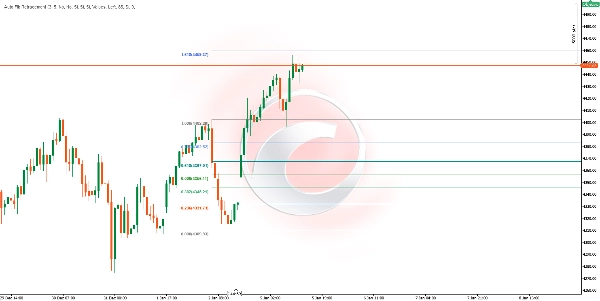
ตัวเลือกการแสดงผล
ตัวเลือก ฟังก์ชัน
ขยายซ้าย / ขวา
ขยายเส้นแนวนอนไปทางซ้ายหรือขวาของกราฟ
แสดงราคา
แสดงราคาที่แน่นอนของแต่ละระดับ
แสดงอัตราส่วน
แสดงอัตราส่วน Fibonacci (ค่า หรือเปอร์เซ็นต์)
ตำแหน่งป้าย
จัดตำแหน่งป้ายไปทางซ้ายหรือขวา
ความทึบของโซน
ควบคุมความโปร่งใสของโซนสีระหว่างระดับ
ระดับ Fibonacci ที่ปรับแต่งได้
แต่ละระดับจาก 22 ระดับสามารถ:
- เปิดหรือปิดใช้งานแยกกัน
- แก้ไขค่าตัวเลขได้
- เปลี่ยนสีได้
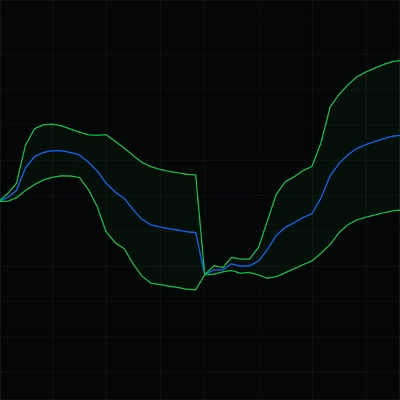
💡 การตีความโซน
โซนสีระหว่างระดับติดต่อกันช่วยให้การระบุด้วยสายตาง่ายขึ้น:
- โซนสีเขียว/น้ำเงิน (0.382 - 0.786): พื้นที่ของการดีดกลับที่ดีในแนวโน้ม เป็นโซนทั่วไปสำหรับการหาจุดเข้าเทรด ✅
- โซนระดับ 1.0: แทนการเคลื่อนไหว 100% ของการเคลื่อนไหวก่อนหน้า ทำหน้าที่เป็นแนวรับ/แนวต้านสำคัญ ⚖️
- โซนสีแดง/ชมพู (1.618+): การขยายของการเคลื่อนไหว ราคาที่ถึงโซนเหล่านี้อาจบ่งชี้ถึงการขยายตัวเกินไป ⚠️
⚠️ข้อควรพิจารณา
- ตัวชี้วัดจะอัปเดต โดยอัตโนมัติ เมื่อมันตรวจจับ pivot สำคัญใหม่
- มันทำงานบน กรอบเวลาหรือสินทรัพย์ทางการเงินใดก็ได้
- ระดับ Fibonacci เป็น โซนความน่าจะเป็น ไม่ใช่การรับประกัน
- แนะนำให้ใช้ร่วมกับตัวชี้วัดอื่นหรือการวิเคราะห์ราคา
- ในตลาดที่เคลื่อนไหวแบบ sideway หรือผันผวน จุด pivot อาจเปลี่ยนแปลงบ่อยครั้ง
📝 บันทึกทางเทคนิค
- ATR 10 ช่วงเวลา ใช้ภายในเพื่อคำนวณเกณฑ์ไดนามิกสำหรับการตรวจจับ pivot
- ตัวชี้วัดต้องการ ข้อมูลประวัติขั้นต่ำเทียบเท่ากับสองเท่าของพารามิเตอร์ Lookback เพื่อทำงานอย่างถูกต้อง
- เส้นและโซนจะ วาดใหม่เฉพาะบนแท่งเทียนล่าสุด เพื่อเพิ่มประสิทธิภาพ 🚀
สรุป
The indicator helps traders identify potential support and resistance zones, define price targets, plan entries on pullbacks, set stop-losses beyond key levels, and confirm reversal zones when price reaches extreme extensions. It works on any timeframe and financial asset, including Forex, stocks, commodities, indices, and cryptocurrencies such as BTCUSD, EURUSD, GBPUSD, XAUUSD, NAS100, and others.
Users can customize parameters like sensitivity, lookback period, direction inversion, and display options (line extension, price and ratio labels, zone opacity, and colors). Colored zones visually highlight key Fibonacci areas for easier interpretation. The indicator updates automatically with new pivots and redraws levels on the latest bar to optimize performance.