
คำอธิบาย
ตัวบ่งชี้ Pinescriptlabs Store: Pinescriptlabs Store cBots : (cBot) Gold & BTC BreakoutSession Pivots(ใหม่)
Prediction Based on Linreg & ATR
SmartTrend Support &
Resistance
Lines
Dynamic
Market Structure
Analysis
of
Turning
Points
Fibonacci
Linear
Regression
Multi-timeframe
Multi-Level
Candle Bias
Tracker
Auto
Support and
Resistance
Trend
Lines
All
Support and
Resistance
Levels
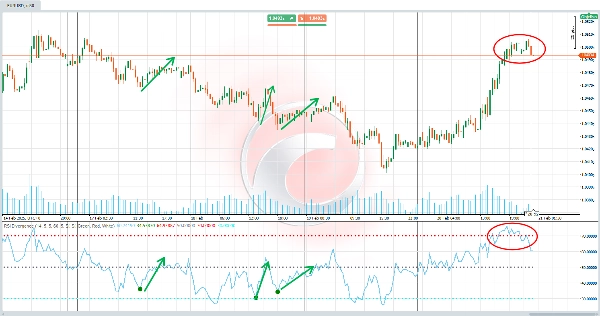
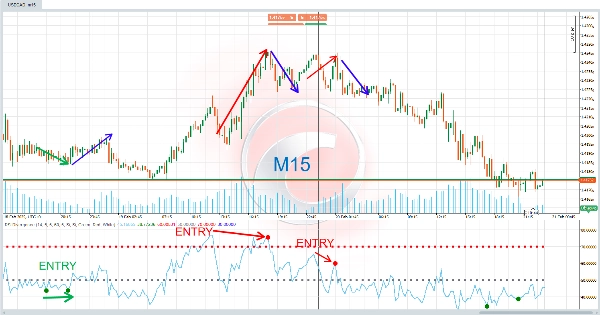
ตัว RSI Divergence เป็นเครื่องมือวิเคราะห์ทางเทคนิคขั้นสูงที่ออกแบบมาเพื่อตรวจจับ ความแตกต่างระหว่างราคาและดัชนีความแข็งแกร่งสัมพัทธ์ (RSI) . ความแตกต่างเหล่านี้เป็นสัญญาณที่ทรงพลังซึ่งสามารถทำนายการเปลี่ยนแปลงในทิศทางของตลาด ทำให้เป็นทรัพยากรที่มีค่าสำหรับนักเทคนิคัลเทรดเดอร์ 🔍💡
⚙️ มันทำงานอย่างไร?
ตัวบ่งชี้นี้ทำงานบนหลักการที่ว่า ราคา และ RSI ไม่ได้เคลื่อนไหวพร้อมกันเสมอไป เมื่อเกิดความแตกต่าง หมายความว่าราคากำลังส่งสัญญาณที่ตรงกันข้ามกับแนวโน้ม RSI พื้นฐาน ซึ่งอาจเป็นสัญญาณเตือนล่วงหน้าว่าแนวโน้มปัจจุบันอาจกำลังสูญเสียความแข็งแกร่ง
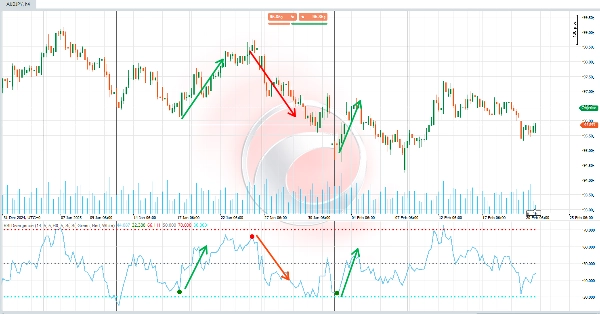
- ความแตกต่างแบบกระทิง (แนวโน้มขาขึ้น) 📈 :
เกิดขึ้นเมื่อ ราคาสร้างจุดต่ำสุดที่ต่ำกว่า แต่ RSI สร้างจุดต่ำสุดที่สูงกว่า ซึ่งบ่งชี้ว่า แม้ว่าราคาจะลดลง แต่แรงขับเคลื่อนขึ้นอาจกำลังเพิ่มขึ้น ซึ่งอาจนำไปสู่การกลับตัวขึ้น ✅ - ความแตกต่างแบบหมี (แนวโน้มขาลง) 📉 :
เกิดขึ้นเมื่อ ราคาสร้างจุดสูงสุดที่สูงกว่า แต่ RSI สร้างจุดสูงสุดที่ต่ำกว่า ซึ่งบ่งชี้ว่า แม้ว่าราคาจะเพิ่มขึ้น แต่แรงขับเคลื่อนลงอาจกำลังเพิ่มขึ้น ซึ่งอาจนำไปสู่การกลับตัวลง ❌
ตัวบ่งชี้จะตรวจจับความแตกต่างเหล่านี้โดยอัตโนมัติและเน้นบนแผนภูมิด้วยสี เส้น และป้ายกำกับเพื่อให้ง่ายต่อการตีความ 🎯
💡 ใช้ทำอะไร?
ตัวบ่งชี้นี้มีประโยชน์อย่างยิ่งสำหรับ:
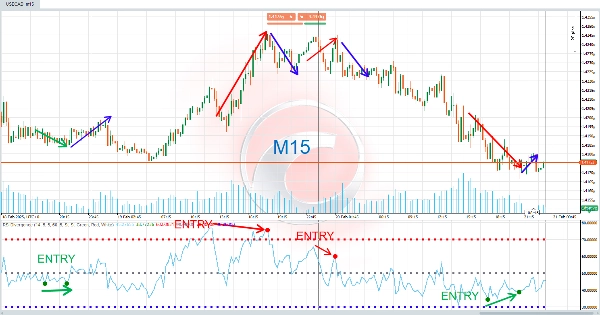
- การระบุจุดเข้าและออก : ความแตกต่างสามารถทำหน้าที่เป็นสัญญาณซื้อ (กระทิง) หรือขาย (หมี) 🛒💸
- การคาดการณ์การเปลี่ยนแปลงแนวโน้ม : ความแตกต่างเป็นสัญญาณล่วงหน้าว่าแนวโน้มปัจจุบันอาจกำลังสูญเสียความแข็งแกร่ง ⚡
- การยืนยันการวิเคราะห์ทางเทคนิค : สามารถใช้ร่วมกับตัวบ่งชี้อื่น ๆ หรือรูปแบบแท่งเทียนเพื่อยืนยันการตัดสินใจซื้อขาย 🧠📊
เหมาะสำหรับทั้งนักเทรดรายวันและนักลงทุนระยะยาว เนื่องจากความแตกต่างสามารถใช้ได้กับทุกช่วงเวลา ⏳📈
🛠️ วิธีใช้?
- การตั้งค่าเริ่มต้น:
-
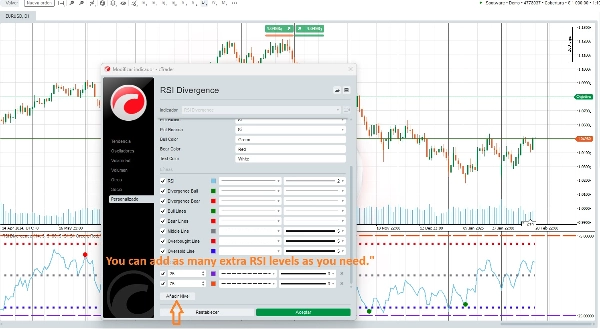
- ปรับแต่งพารามิเตอร์ตามความต้องการ เช่น ช่วงเวลาของ RSI, ช่วงการค้นหาจุดหมุน, และสีของสัญญาณ 🎨⚙️
- เปิดหรือปิดการแสดงความแตกต่างแบบกระทิงหรือแบบหมีตามความชอบของคุณ ✅❌
- การตีความสัญญาณ:
-
- ความแตกต่างแบบกระทิง : เมื่อสัญญาณ "D" สีเขียวปรากฏบนแผนภูมิ แสดงถึงโอกาสซื้อที่เป็นไปได้ 🟩🛒
- ความแตกต่างแบบหมี : เมื่อสัญญาณ "D" สีแดงปรากฏบนแผนภูมิ แสดงถึงโอกาสขายที่เป็นไปได้ 🟥🚫
- นอกจากนี้ เส้นที่เชื่อมจุดความแตกต่างจะถูกวาดขึ้นเพื่อช่วยในการวิเคราะห์ด้วยสายตา 📐🔗
- การตัดสินใจ:
-
- ใช้สัญญาณเหล่านี้เพื่อปรับกลยุทธ์ของคุณ เช่น การเปิดตำแหน่ง, ปิดการซื้อขายที่มีอยู่, หรือปรับระดับ stop-loss 🤝💼
🆕 การปรับแต่งขั้นสูง!
🌟 คุณสามารถเพิ่มระดับ RSI ได้ตามที่ผู้ใช้ต้องการ 🌟
ตัวบ่งชี้นี้ช่วยให้คุณปรับแต่งประสบการณ์การเทรดของคุณได้อย่างเต็มที่ คุณสามารถเพิ่มระดับ RSI หลายระดับเพื่อให้เหมาะกับกลยุทธ์และสไตล์การเทรดที่แตกต่างกัน เช่น การตั้งค่าระดับ overbought และ oversold เพิ่มเติม หรือแม้แต่ปรับช่วงเวลาของ RSI ให้เหมาะกับช่วงเวลาที่แตกต่างกัน 🔄📈📉
สรุป
Designed for use on any timeframe, the indicator helps traders identify entry and exit points, anticipate trend changes, and confirm other technical analysis signals. Users can customize parameters such as RSI period, pivot search ranges, signal colors, and enable or disable specific divergence types. Additionally, multiple RSI levels can be added to tailor the indicator to various trading strategies and styles.
This tool is suitable for intraday traders and long-term investors across markets including cryptocurrencies (e.g., BTCUSD), commodities (e.g., gold, XAUUSD), and indices. It supports enhanced decision-making by providing early warnings of trend strength shifts based on RSI divergence analysis.
รีวิวจากลูกค้า
5 | 0 % | |
4 | 100 % | |
3 | 0 % | |
2 | 0 % | |
1 | 0 % |


!["[Stellar Strategies] MARSI Signal Plotter" โลโก้](https://cdn.ctrader.com/image/webp/7b2b8da6-8f8e-4646-8d4a-4710c516c01e_25567)


