
Standard Deviation Channel
지표
2 구매
버전 1.0, Oct 2025
Windows, Mac
5.0
리뷰: 1
설명
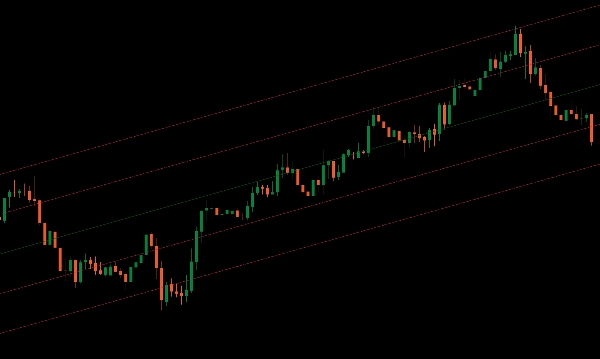
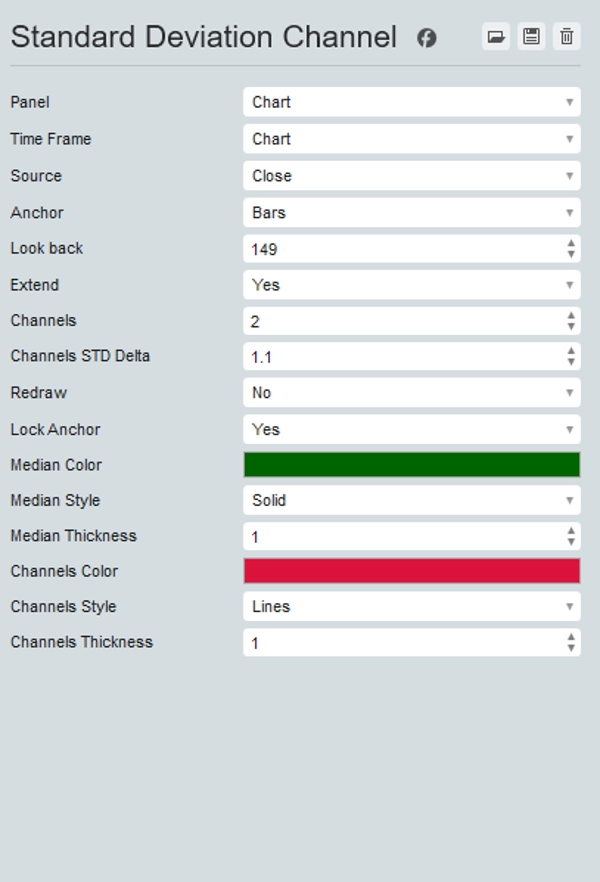
cTrader용 표준 편차 채널 지표를 소개합니다. 이 강력한 도구는 시장 추세를 정밀하게 시각화하는 데 도움을 줍니다.
이 지표는 차트에 지정된 기간의 중앙값을 표시하여 가격 움직임의 중심 기준점을 제공합니다.
또한 표준 편차의 배수로 원하는 수만큼 상단 및 하단 채널을 추가할 수 있어 가격 변동성과 잠재적 돌파 구역을 명확하게 파악할 수 있습니다.
향상된 분석 기능을 원하는 트레이더에게 완벽한 표준 편차 채널 지표는 추세 방향과 잠재적 반전 지점을 쉽게 식별하는 데 도움을 줍니다.
우수한 시장 분석과 의사 결정을 위해 표준 편차 채널로 트레이딩 도구를 업그레이드하세요.
요약
지표 프로필
고객 리뷰
5.0
리뷰: 1
5 | 100 % | |
4 | 0 % | |
3 | 0 % | |
2 | 0 % | |
1 | 0 % |
고객 리뷰
October 31, 2025
The product earns time when it makes the setup easier to question, and 3 sessions is a fair first sample.
상담
자주 묻는 질문(FAQ)
BTCUSD
Forex
Breakout
Indices
EURUSD
Commodities
GBPUSD
NZDUSD
Prop
Scalping
Crypto
Grid
Stocks
XAUUSD
NAS100
USDJPY
트레이딩 봇, 지표, 플러그인 등 cTrader Store에서 제공되는 상품은 제3자 개발자에 의해 제공되며, 이는 단순히 정보 및 기술적 접근을 목적으로 제공된 것입니다. cTrader Store는 중개인이 아니며, 투자 조언, 개인별 추천 또는 향후 성과에 대한 어떠한 보장도 제공하지 않습니다.


가격
가입일 25/09/2025
25
판매
331
무료 설치